Difference between revisions of "Color data series in area charts"
| Line 1: | Line 1: | ||
[[Category:Data series and data points in area charts]] | [[Category:Data series and data points in area charts]] | ||
| − | | + | {{HelpFiles_Report_Module}} |
=====Color data series in area charts===== | =====Color data series in area charts===== | ||
Latest revision as of 13:04, 13 December 2011
Color data series in area charts
In an area chart, the area underneath the data points in a data series could be filled with color. To change the color of this area:
- In the External Style Sheet editor, under Data series, select Area series, or in the Inline Style Sheet editor, under Data series, select Series.
- On the right-hand area of the editor you are using, select the entry associated with the data series you want from the Series list, and then find the Fill setting group on the right side of the area (see the picture below).
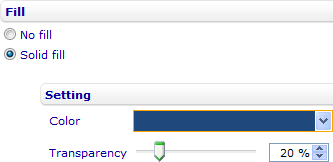
- Use the provided settings to color the area the way you want.
