Difference between revisions of "Change bubble shapes in bubble charts"
| Line 1: | Line 1: | ||
[[Category:Data series and data points in bubble charts]] | [[Category:Data series and data points in bubble charts]] | ||
| − | | + | {{HelpFiles_Report_Module}} |
=====Change bubble shapes in bubble charts===== | =====Change bubble shapes in bubble charts===== | ||
Latest revision as of 13:11, 13 December 2011
Change bubble shapes in bubble charts
To change the shape of all the bubbles in a bubble chart:
- In the External Style Sheet editor, under Data series, select Bubble series, or in the Inline Style Sheet editor, under Data series, select Series.
- On the right-hand area of the editor you are using, select the data series entry from the Series list, click the More options button at the bottom right-hand corner of the right side of the area, and then find the Bubble type setting group in the dialog that turns up (see the picture below).
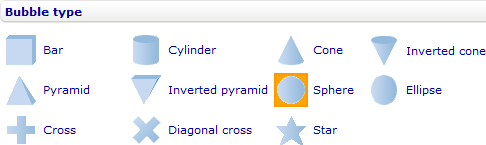
- Select the shape you want the bubbles to look like from the available options under the group.
