Case: Tracking diagram for open tasks
Case: Tracking diagram for open tasks
It can be difficult to figure out how to twitch Catglobe to solve unique reporting needs, but with a bit of ingenuity most requirements can be met. The following help file shows you how it is possible to make a tracking diagram for a company that shows the development of open tasks over time and split up per department.
First let us go through the scenario that this case offers us.
Time set for reporting open tasks
First step will be to decide the frequency with which we want to see the development of open tasks. Let us assume that we are interested in seeing the development on a weekly basis and that we are situated in Denmark. Our time set could then look like below:

Tasks in the company
Our company has added a parameter on all tasks that specifies which team the tasks belong to. Whenever we create a task we must thus specify a team for it.
Any task has 5 possible states:
• Need acceptance
• Rejected
• Waiting for approval
• In progress
• Approved
• Cancelled
Our company has decided that open tasks are defined as those that have either status ‘Need acceptance’ or ‘In progress’.
Extracting open tasks to a data cache
Next step is to make a resource data cache which extracts all open tasks at any given point of time. To do this we will make a search on the task resource list as follows:

Now we have a list of all open tasks and will make a data cache with them by using the ‘Generate resource cache’ button from the task resource list’s drop down menu.

Since we already know that all the tasks being extracted are ‘open’, all the information we really need is to know which team a task belongs to. We therefore choose the column ‘Property_Team’ as the only column for the resource cache.

On saving the cache the ‘Axis set’ tab will be activated. Under the Axis that was created for Team, you will find the specific expressions needed to filter out open tasks from any team in the company. These expressions we will need later when we are creating a tabulation script.

Final step for the new resource cache will be to have it automatically update with the same frequency as the frequency with which we wish to report on open tasks. As you remember, we chose that this would be weekly, so we will have the resource cache be updated weekly as well.

Since we want a tracking diagram it will not be enough to just report on the data that exists in this RCS at any time. We will need to ‘save’ the information each week so we can compare the results across weeks. First step will be to create a questionnaire into which we can save the results.
Creating a questionnaire to hold open task results per week
Create a questionnaire with questionnaire template called e.g. ‘Open tasks’. Create in this questionnaire just one single question called ‘Team’, where each option in the question corresponds to one of the options that also exist in the task property called ‘Team’.
Let us assume that the Team question looks like below:

Creating a tabulation resource to move information from the resource cache to the questionnaire
Next step is to create a tabulation resource which will ‘read’ the resource cache that we created and for each found task it will create an answer sheet in the new questionnaire. The related data cache will be the resource cache that we created with open tasks.
Below is how we would write this script for the tabulation resource
Next step is to run the above tabulation every 7 days, to ensure that the resource cache (which is also updated once a week) will create new unique answer sheets for each open task. We should run the tabulation script every 7 days with starting time an hour later than when the resource cache was automatically run.
Below is shown how we set automatic executions of the tabulation resource.
//BEGIN scripts
//Define variables
array newRPQ;
number totalTask;
number i;
number newRPQId;
number questionnaireResourceId = 151624;
//Rebuild the resource cache first
DCS_rebuild();
//-----Open Tasks for Accounting
//Count all Open Tasks of Accounting
totalTask = (count() where (Property_365 == 140));
//Loop - create new answer sheets and set value to them
for (i = 0; i < totalTask; i = i + 1)
{
newRPQ = QAS_new(questionnaireResourceId);
newRPQ[QAS_COMPLETED] = true;
QAS_save(newRPQ);
newRPQId = newRPQ[QAS_ID];
setRPQId(newRPQId);
Team = 1;
}
//-----Open Tasks for HR
//Count all Open Tasks of HR
totalTask = (count() where (Property_365 == 141));
//Loop - create new answer sheets and set value to them
for (i = 0; i < totalTask; i = i + 1)
{
newRPQ = QAS_new(questionnaireResourceId);
newRPQ[QAS_COMPLETED] = true;
QAS_save(newRPQ);
newRPQId = newRPQ[QAS_ID];
setRPQId(newRPQId);
Team = 2;
}
//-----Open Tasks for Administration
//Count all Open Tasks of Administration
totalTask = (count() where (Property_365 == 142));
//Loop - create new answer sheets and set value to them
for (i = 0; i < totalTask; i = i + 1)
{
newRPQ = QAS_new(questionnaireResourceId);
newRPQ[QAS_COMPLETED] = true;
QAS_save(newRPQ);
newRPQId = newRPQ[QAS_ID];
setRPQId(newRPQId);
Team = 3;
}
//-----Open Tasks for Sales
//Count all Open Tasks of Sales
totalTask = (count() where (Property_365 == 157));
//Loop - create new answer sheets and set value to them
for (i = 0; i < totalTask; i = i + 1)
{
newRPQ = QAS_new(questionnaireResourceId);
newRPQ[QAS_COMPLETED] = true;
QAS_save(newRPQ);
newRPQId = newRPQ[QAS_ID];
setRPQId(newRPQId);
Team = 4;
}
//-----Open Tasks for Marketing
//Count all Open Tasks of Marketing
totalTask = (count() where (Property_365 == 158));
//Loop - create new answer sheets and set value to them
for (i = 0; i < totalTask; i = i + 1)
{
newRPQ = QAS_new(questionnaireResourceId);
newRPQ[QAS_COMPLETED] = true;
QAS_save(newRPQ);
newRPQId = newRPQ[QAS_ID];
setRPQId(newRPQId);
Team = 5;
}
//END scripts

Extracting data from the questionnaire to a data cache
It is now time to build another data cache that will get its data from the new questionnaire that we created. We really only need two columns in this data cache, namely ‘StartDate’ and ‘Team’.

Make sure that the Axis Set created an Axis for the Team column.
Finally schedule that this data cache is rebuilt one hour later than the tabulation script is rebuilt every week.

With this we now have a data cache which holds information on open tasks per team per date and which automatically will update this information each week, while keeping historical values intact. We can now finally create a tracking diagram to view the results.
Creating a tracking diagram using the Dashboard module
It is possible to fully create a tracking diagram using the Dashboard module.
Step 1 will be to create the dashboard and relate to it the data cache extracting information from our newly created questionnaire.
Step 2 will be to create three items in the dashboard.
- A time set item using the time set that we created earlier on (“Danish time zone week”).
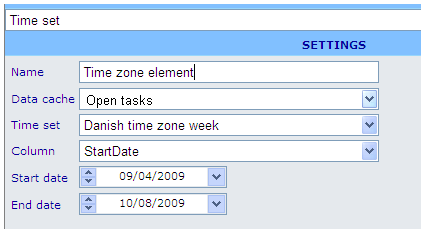 This time set will use the StartDate column from the data cache.
 - A hidden axis item to hold the information on axis to be use for the series of our tracking diagram.
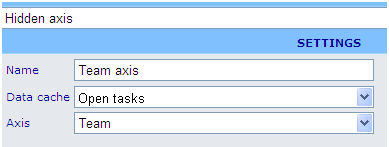 The series will of course be the different teams in our company, so this is the column we will include.
 - Finally we will add a cross diagram item using the two prior items.
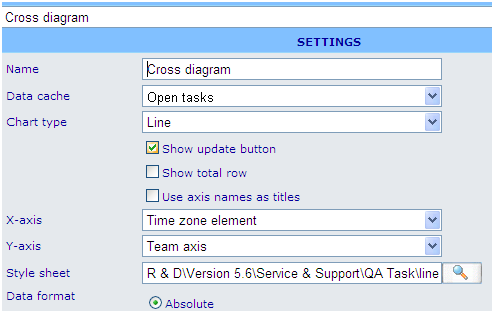


The Tracking Diagram
We now have a dashboard that can show the development of open tasks by week. An example of how this may look is shown below:
