Change bubble sizes in bubble charts
Change bubble sizes in bubble charts
The bubbles in a bubble chart are different in size depending on their data. You can limit the biggest and smallest bubbles to certain sizes by following the steps below:
- In the External Style Sheet editor, under Data series, select Bubble series, or in the Inline Style Sheet editor, under Data series, select Series.
- On the right-hand area of the editor you are using, select the data series entry from the Series list, and then find the Bubble size setting group on the right side of the area (see the picture below).
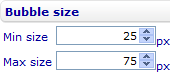
- Change the size of the smallest bubble and that of the biggest one by entering numbers of pixels in the Min size and Max size numeric input fields respectively. The chart will automatically readjust the sizes of the other bubbles accordingly.
