Change the border style of bubbles in bubble charts
Change the border style of bubbles in bubble charts
To change the border style of all the bubbles in a bubble chart:
- In the External Style Sheet editor, under Data series, select Bubble series, or in the Inline Style Sheet editor, under Data series, select Series.
- On the right-hand area of the editor you are using, select the data series entry from the Series list, click the More options button at the bottom right-hand corner of the right side of the area, and then find the Border setting group in the dialog that turns up (see the picture below).
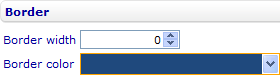
- Change the border width of the bubbles by entering a number of pixels in the Border width numeric input field.
- Change the border color of the bubbles by selecting a color from the Border color drop-down list.

To change the border style of an individual bubble:
- In the External Style Sheet editor, under Data series, select Bubble series, or in the Inline Style Sheet editor, under Data series, select Series.
- On the right-hand area of the editor you are using, expand the data series entry in the Series list, select the data point entry associated with the bubble, click the More options button at the bottom right-hand corner of the right side of the area, and then find the Border setting group in the dialog that turns up (see the picture below).
- Select the Use data series settings check box on the right side of the title bar of the group (see the picture below) if you want the bubble to have the same border style as the series.
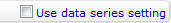
- Since you actually want the bubble to have a different border style, you clear the Use data series settings check box and then proceed to the next step.
- Change the border width of the bubble by entering a number of pixels in the Border width numeric input field.
- Change the border color of the bubble by selecting a color from the Border color drop-down list.
Note: In the inline style sheet of a bubble chart, if you want to decide whether the Border setting group of a data point has the same setup as the data series, you have to turn off the inheritance mode of that group first so that it does not inherit settings from the external style sheet of the chart. You do this through the Inline Style Sheet editor by clearing the Inherit check box on the right side of the title bar of the group (see the picture below). After that, you can select or clear the Use data series settings check box at will.
![]()