Change the line style of data series in area charts
Change the line style of data series in area charts
In an area chart, the data points in a data series are connected by a line. To change the style of this line:
- In the External Style Sheet editor, under Data series, select Area series, or in the Inline Style Sheet editor, under Data series, select Series.
- On the right-hand area of the editor you are using, select the entry associated with the data series you want from the Series list, and then find the Line style setting group on the right side of the area (see the picture below).
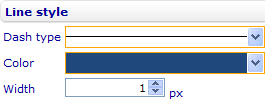
- Change the line type of the line by selecting an option from the Line type drop-down list.
- Change the color of the line by selecting a color from the Color drop-down list.
- Change the width of the line in pixels by entering a number in the Width numeric input field. (Tip: Enter 0 if you want to hide the line.)
