Change the style of data point markers in radar charts
Change the style of data point markers in radar charts
In a radar chart, a marker represents a data point in a data series.
To change the style of the markers in a data series:
- In the External Style Sheet editor, under Data series, select Radar series, or in the Inline Style Sheet editor, under Data series, select Series.
- On the right-hand area of the editor you are using, select the entry associated with the data series you want from the Series list, and then click the More options button at the bottom right-hand corner of the right side of the area to open the dialog containing all the marker style settings of the selected data series. These settings are organized into three different groups, including: Marker type, Marker size and Marker color.
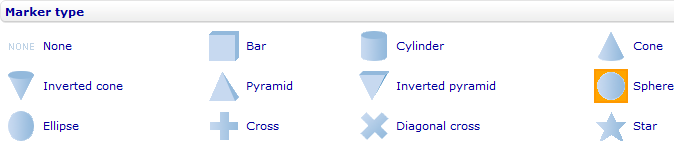
- To change the type of the markers, in the Marker type group (see the picture below), select one of the following options: None (no markers), Bar, Cylinder, Cone, Inverted cone, Pyramid, Inverted pyramid, Sphere, Ellipse, Cross, Diagonal cross and Star.
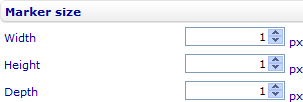
- To change the size of the markers, in the Marker size group (see the picture below), enter the new size you want in pixels, in the Width, Height, and Depth numeric input fields.
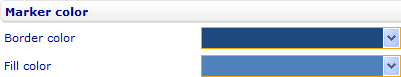
- To change the colors of the markers and their borders, in the Marker color group (see the picture below), select the colors you want from the Border color and Fill color drop-down lists.