Color data series in radar charts
Color data series in radar charts
In a radar chart, the area bounded by the data points in each data series could be filled with color. To change the color of this area:
- In the External Style Sheet editor, under Data series, select Radar series, or in the Inline Style Sheet editor, under Data series, select Series.
- On the right-hand area of the editor you are using, select the entry associated with the data series you want from the Series list, and then find the Fill setting group on the right side of the area (see the picture below).
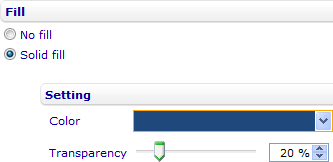
- Use the provided settings to color the area the way you want.
