The cross and quick report viewer/editor logics
<accesscontrol>Main:MyGroup</accesscontrol>
Contents
The cross and quick report viewer/editor logics
The cross diagram and the quick report viewers are using very similar GUIs. Both will be explained in the following chapter including the settings that exist in the cross diagram editor for setting up the cross diagram viewer. Both the cross diagram and the quick report editor interact with the CDG object, so the settings that exist in this object of course deeply influences how they work.
The cross diagram editor
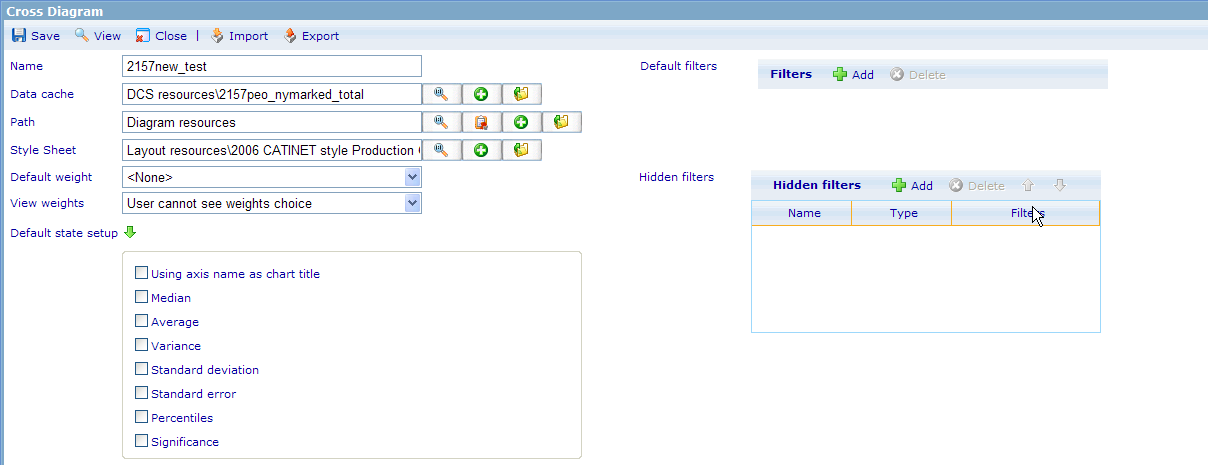
In this one exists a number of settings that we have seen can be used for both Expression Table request and Chart request. Let us quickly go through these since we in earlier chapters have already explained how these settings are used.
- Data cache: Every diagram must have this related. It is sent to the viewer which will use it as an important parameter when instantiating.
- Style sheet: Will decide how all diagrams generated via the viewer will look. Is not possible to change in the viewer.
- Default weight: This setting may or may not be possible to change in the viewer. It depends on the setting chosen by the user in “View weights”. There will only be weights shown here if the user has actually chosen a Data Cache and this Data Cache has weights.
- View weights: Two possible options; one will not allow user to change weight in viewer (namely “User cannot see weights choice”) and one where the user can actually change (“User can see weights choice and choose”).
- Default state setup: There are a number of settings that can be chosen in the viewer. The settings here allow the user to choose default settings when instantiating the viewer.
- Default filters: These filters will be used as defaults when seeing the exact same control in the viewer. This control can only be used after a user has chosen a data cache.
- Hidden filters: To understand how hidden filters work please go to the chapter explaining this. Basically any diagram being generated via the viewer will go through the process of checking whether any hidden filters relate to the user who is using the cross diagram viewer and if so, the hidden filter will be combined with any other filters that exist into the common filter expression for the Expression Table Request.
The cross diagram viewer
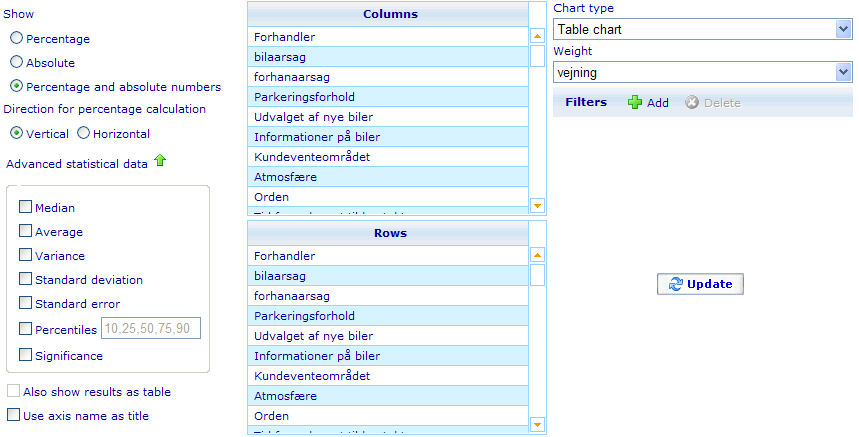
As can be seen in the Cross Diagram Viewer, many of the options that exist are directly related to a parameter given to the Cross Diagram Viewer. The following chapter will therefore mostly discuss what I believe is wrong with the way the viewer is technically working and what should be changed.
The options that are available in most of the fields in the viewer are dependent on the Chart type that the user wishes to create. All of these logics are unfortunately placed in the viewer rather than as an effect of what the “chart type object” looks like. This has the unfortunate effect that all the new chart types that have been added in v5.6 are not yet available in this view. IF all the settings in this viewer had been coded to depend on the settings of the “chart type objects” then it would be a simple matter to extend the viewer to use all existing chart types. (notice that I have given my interpretation of what a “chart type object” is in the chapter Chart Type Object Settings).
Let me go through each of the rules that should exist in the GUI and that should depend on the Chart Type Object Settings instead of having been hard-coded. Also notice that my proposed logic in some places differ from the current logic, since I believe the current logic in some instances is slightly restrictive.
1. The change of chart type should still be the main factor influencing all settings in the viewer. The drop down of which chart types are offered should be dependent on the object setting called “Use in cross diagram viewer (True/False)”.
2. The number of allowed columns to select in the “Columns” list should depend on the object setting called “Allowed column header levels (Integer)”. When changing from a chart type that allows more to one that allows less then the highest indexed chosen options should be removed until the allowed chosen number of columns in regards to the newly selected chart type is legal. If object setting is “0” (zero) then the field should be disabled and all selections removed.
3. The number of allowed columns to select in the “Columns” list should depend on the object setting called “Allowed row header levels (Integer)”. When changing from a chart type that allows more to one that allows less then the highest indexed chosen options should be removed until the allowed chosen number of rows in regards to the newly selected chart type is legal. If object setting is “0” (zero) then the field should be disabled and all selections removed.
4. Another chart type object setting that should influence The Columns and Rows choices fields is the two object settings “Number of series (Integer)” and “Number of items (Integer)”. Currently I find it a bit of a mess that limiting factor for different chart types may be both series and items, but I hope this is changed (request has been sent). Until then I will explain a slightly more complex logic by which both Rows and Columns selectors should work in the GUI. a) The object settings “Number of series (Integer)” and “Number of items (Integer)” are ignored unless both of the two settings “Allowed row header levels (Integer)”and “Allowed column header levels (Integer)” are equal to 1. b) If not ignored as prescribed by the logic of a) then only axes with <“Number of series (Integer)”> axis items will allowed in the Columns list. ∞ means that any number will be allowed. c) If not ignored as prescribed by the logic of a) then only axes with <“Number of items (Integer)”> axis items will allowed in the Rows list. ∞ means that any number will be allowed.
5. The availability of the “Percentage and Absolute Numbers” radio button in Show Type choice should depend on the setting called “Allow Show Type Both (True/False)”. If a user changes from a chart type that allows Both (and Both (=percentage and absolute numbers) was chosen) to one that does not then the Show Type should change to Absolute.
6. The Direction of Percentage choice should only be activated when the Show Type “Percentage” or “Percentage and Absolute Number” is chosen and neither Rows or Columns choices are deactivated
7. Each of the statistics choices will only be enabled for a chart type if their corresponding Chart Type Object Setting is set to true. These Settings are Allow 'Median' Statistics Item (True/False), Allow 'Average' Statistics Item (True/False), Allow 'Variance' Statistics Item (True/False), Allow 'StdDev' Statistics Item (True/False), Allow 'Percentile' Statistics Items (True/False), Allow 'Significance' Statistics Item (True/False), and Allow 'StdError' Statistics Item (True/False). If changing from one chart type where any of the settings above are allowed and the corresponding check box is checked to a chart type where it is not allowed, then this check box will be set to false and disabled.
8. If a chart type has the object setting Allow empty cells on Show Type Both (True/False) set to False while a user changes his show type to “Percentage and Absolute” then all the Statistics settings will be disabled and set to False. (there are of course many other use cases to be made for the GUI for this interaction logic in regards to different situations, but the reader should from this get an idea of the logic I am pursuing, so any further specifications will be done in a feature design.
9. The check box “Also show results as table” is only activated when the object setting Allow Show Results as Table (True/False) is set to True. If a user changes from a chart type that has Show Results as Table (True/False) =True and “Also show results as table” checked, to a chart type that has Show Results as Table (True/False) = False then the check box should be unchecked and disabled.
The fields “Weight, Filters, Use axis name as title” are not influenced by Chart Type selection.
Please notice that some of the Object settings are also useful as validation rules of view area on the spread sheet editor! Since I believe that the way this Viewer should be instantiated is quite self evident from what I have told in this chapter as well as the previous chapter on the Cross Diagram Editor, I will explain this in no more detail. Just make sure to send all parameters that are in the “background” of the cross diagram object (style sheet, weight choice (when hidden), hidden filters and data cache choice) as well as those choices made in the Viewer to the Cross Diagram Expression Table Request as well as to the Chart Request, when user asks to see a chart.
The Quick Report Editor
The quick report is a quick way of making a report and report template with lots of diagrams from the same data cache. Once a quick report is saved it is converted into a standard report and it is not possible to open again using the quick report editor.
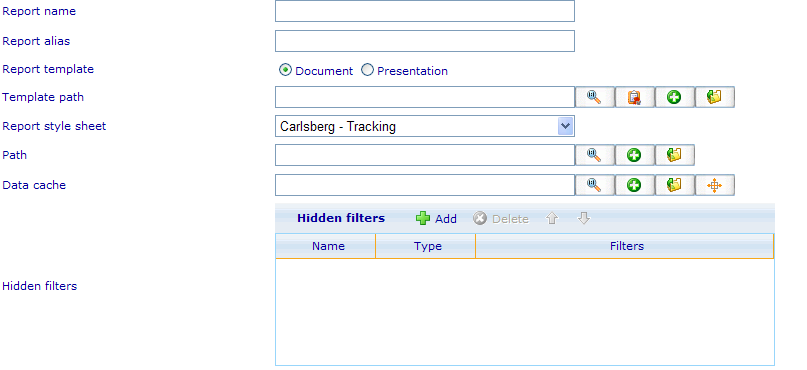
The top part of the quick report editor is quite similar to the cross diagram editor, but most of these values are used to save information to the Diagram, Report and Report Template resources that will be created. The data is placed as follows:
- Report name: Used for both Report and Report Template resource names
- Report alias: Used for Report resource.
- Report template: Used for Report Template resource to decide Template Type.
- Template path: Used for path of Report Template resource. Report style sheet: Used for Report resource.
- Path: Used for path of Report resource.
- Data cache: Used for each of the Diagrams created and related to the Report Template.
- Hidden filters: Used for the Report resource.
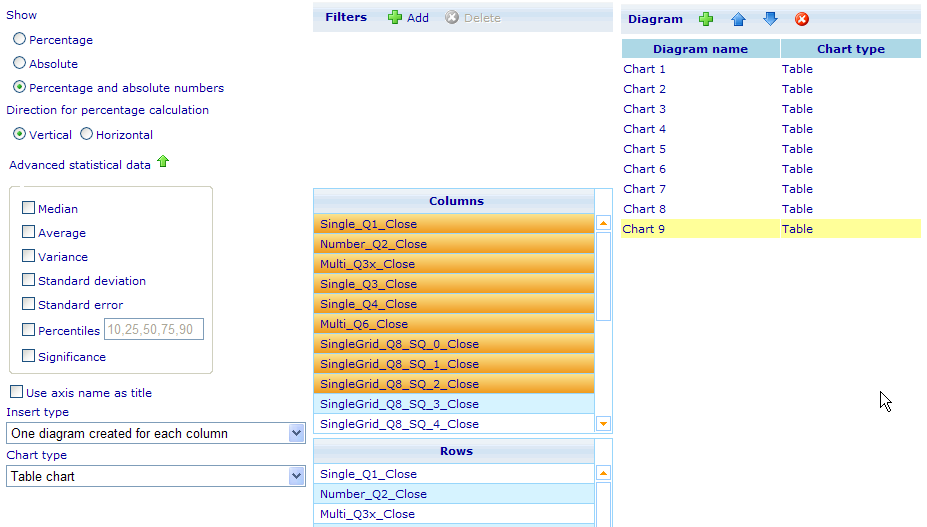
The bottom part of the quick report editor is focused on the specification of the diagrams to be placed in the Report Template being created.
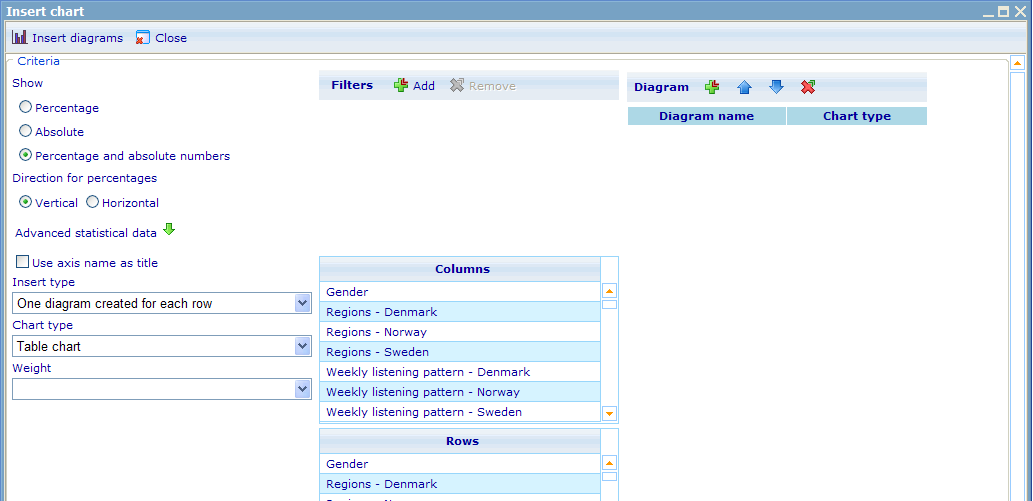
You will notice that it is very similar to the cross diagram viewer although with a few differences that will be explained. Albeit these differences I believe that the editors should use the same GUI control. Definitely important that both utilize the chart objects to specify the GUI logics.
The main feature differences are:
1. User can create multiple diagrams at the same time from this GUI.
2. The diagrams being created will be placed in the diagram list on the right when clicking the add button on the tool bar of that list.
3. The diagram list is a session array of diagrams. Only when saving the report will all the diagrams be generated.
4. The column and row logics are different from the quick report in that the number of possible choices depend on the “Insert Type” selected. How this insert type works will be explained further down.
5. Quick report does not have the option “Also show results as table”.
Now let us dig into the differences that should exist in the GUI logic given we still use Chart Type Object Settings.
1. Basically all the logics relating to choice of Chart Type and how this influences the selections: Statistics, Direction, and Show Type are exactly the same. “Use in cross diagram viewer (True/False)” should also still influence the Chart Type selection. Similarly “Allow empty cells on Show Type Both (True/False)” will also have an influence on statistics choices.
2. When Insert Type is “A multi level diagram” then the Column and Row fields should work in exactly the same way as Cross Diagram.
3. Insert Type “One diagram created for each row” is only available if chosen Chart Type has Allowed row header levels (Integer) > 0.
4. Insert Type “One diagram created for each column” is only available if chosen Chart Type has Allowed column header levels (Integer) > 0.
5. Whenever “One diagram created for each row” is chosen and Row is not disabled, then user can choose any number of rows. Columns are still limited by Object Setting Allowed column header levels (Integer).
6. Whenever “One diagram created for each column” is chosen and Column is not disabled, then user can choose any number of rows. Rows are still limited by Object Setting Allowed row header levels (Integer).
7. AS WITH CROSS DIAGRAM VIEWER: a) The object settings “Number of series (Integer)” and “Number of items (Integer)” are ignored unless both of the two settings “Allowed row header levels (Integer)”and “Allowed column header levels (Integer)” are equal to 1. b) If not ignored as prescribed by the logic of a) then only axes with <“Number of series (Integer)”> axis items will allowed in the Columns list. ∞ means that any number will be allowed. c) If not ignored as prescribed by the logic of a) then only axes with <“Number of items (Integer)”> axis items will allowed in the Rows list. ∞ means that any number will be allowed.
8. When user has selected Insert Type “One diagram created for each row”; highlighted multiple rows and no columns; then one diagram will be created for each row selected when adding diagrams to the diagram list.
9. When user has selected Insert Type “One diagram created for each column”; highlighted multiple columns and no rows; then one diagram will be created for each column when adding diagrams to the diagram list.
10. When user has selected Insert Type “One diagram created for each row”; highlighted multiple rows and one or more columns; then one diagram will be created for each row selected when adding diagrams to the diagram list; each of these diagrams will be crossed with the selected column(s).
11. When user has selected Insert Type “One diagram created for each column”; highlighted multiple columns and one or more rows; then one diagram will be created for each column when adding diagrams to the diagram list; each of these diagrams will be crossed with the selected row(s).
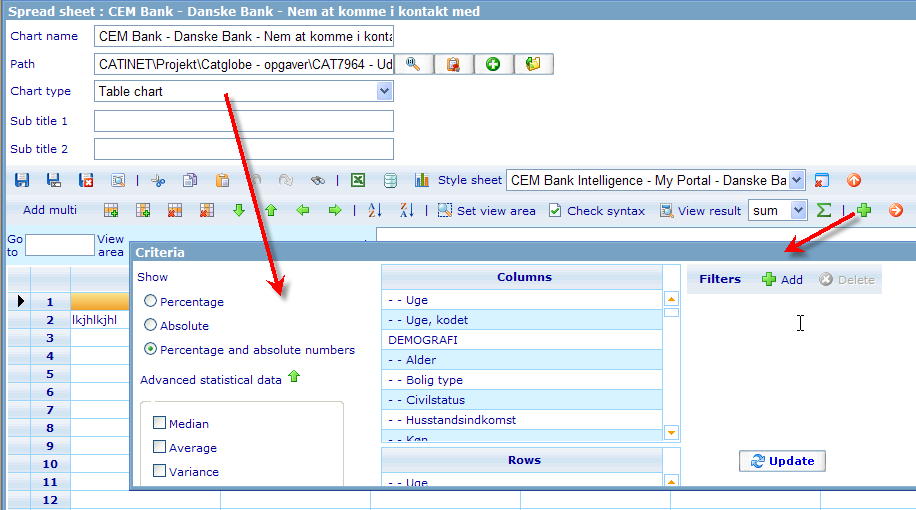
Cross diagram viewer in the spread sheet editor
There is actually one more version of the cross diagram viewer that very few people are aware of. It can be accessed from the spread sheet editor. We will just very quickly explain it here since there will later be a more detailed explanation of the spread sheet editor.
This version is the same as the cross diagram viewer except for the following differences:
1. Chart type is hidden; instead “retrieved” from the chart type selection on the spread sheet
2. It does not have the option “Also show results as table”.
3. There are no weights choices.
4. Since these is no “cross object” then there is no place to retrieve weights and hidden filters from and these are therefore not used.
5. When you click “Update” it will not create a chart; rather it will create an expression sheet which it will return to the spread sheet editor and insert into the relevant cells.
Some comments from me in regards to working more deeply with this feature:
1. Talk with Ulrik on whether or not it is a used feature. I don't mind if it is removed.
2. You may need to check whether or not Significance is actually added to the spread sheet (diagram) object.
Quick report in the document template editor
The quick report editor (bottom part of it at least) can also be opened from the document template editor. When a number of diagrams are created here and user the decides to insert them into the document report, then the same process as quick report is done, except that it needs not create a report and report template and it inserts the diagrams into the report where the user has his cursor placed before initiating the feature. Below you can see the dialog that is opened from inside the document editor.
A notice to this feature is, that we may as well also add it to the presentation editor, so that the two editors as much as possible are offering the same features.
