Standard editor - How to use constants: Difference between revisions
From Catglobe Wiki
More actions
No edit summary |
No edit summary |
||
| (2 intermediate revisions by the same user not shown) | |||
| Line 43: | Line 43: | ||
[[Image:Input constant value.jpg]] | [[Image:Input constant value.jpg]] | ||
=== 5. INSERT STANDARD CHART | === 5. INSERT CONSTANT INTO STANDARD CHART AND VIEW<br> === | ||
*To access the Report template, highlight your report in the in Report list and click on "Template"<br> | *To access the Report template, highlight your report in the in Report list and click on "Template"<br> | ||
[[Image: | [[Image:Open report template.jpg]]<br> | ||
*In report template, click button "Insert chart" to insert standard diagram <br> | |||
[[Image:Report - Insert chart.jpg]]<br> | |||
*Click on button "C" to open template constant<br> | |||
*Highlight a constant and insert to chart | |||
[[Image:Report - Chart - Insert constant.jpg]] | |||
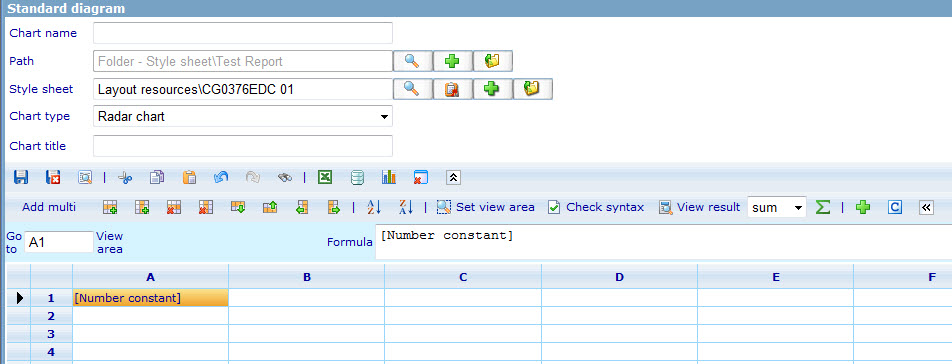
*A constant was inserted to chart | |||
[[Image:Report - Chart - Constant.jpg]]<br> | |||
*Edit anything in diagram as you want and save chart | |||
*Save Report template | |||
*Highlight the report and view it in order to see constant value in chart | |||
[[Image:Report - View constant.jpg]] | |||
<br> {{note}}You cannot see constant value if you preview Report template. | |||
[[Category:Quick_start]] | [[Category:Quick_start]] | ||
Latest revision as of 11:48, 9 December 2011
STANDARD CHART EDITOR - HOW TO USE CONSTANTS
1. GO TO THE REPORT MODULE
- Go to "Tools" -> "Reports" -> "Reports".
2. CREATE A NEW REPORT
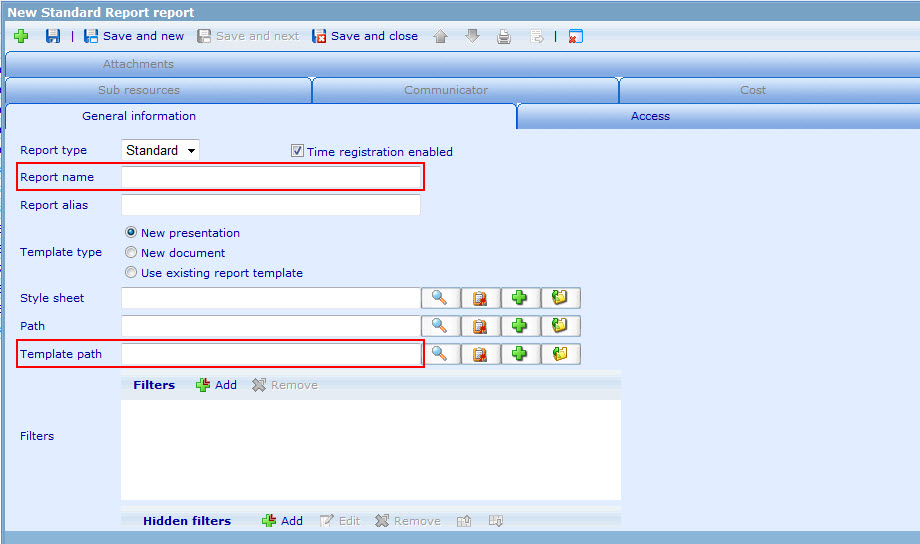
- Choose Report type (Standard, Personal, Dynamic).
- Type a name for the report in the "Report name" box (required).
- Type an alias for the report in the "Report alias" box (if users want).
- Choose Template type. If you want to use existing Report template for new report, choose option 3.
- Find a style sheet for the charts of report.
- Find Path or not.
- Find Report template path (required).
- Save report then Report template button appear.
3. CREATE TEMPLATE CONSTANT
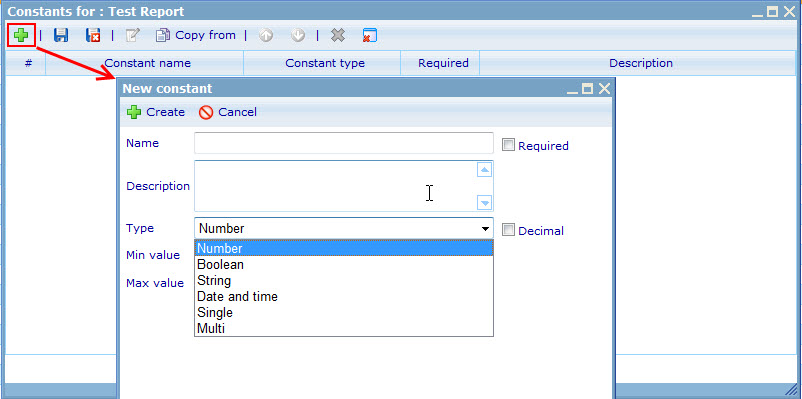
- Highlight a report then go to menu Edit -> Template constants
- A dialog appear, user input Name, Description, Type.
- Click Create then save Template constant.
4. INPUT CONSTANT VALUE
- After add Template constant, currenly Constants tab in Report is appeared, users open Constant tab and input value
5. INSERT CONSTANT INTO STANDARD CHART AND VIEW
- To access the Report template, highlight your report in the in Report list and click on "Template"
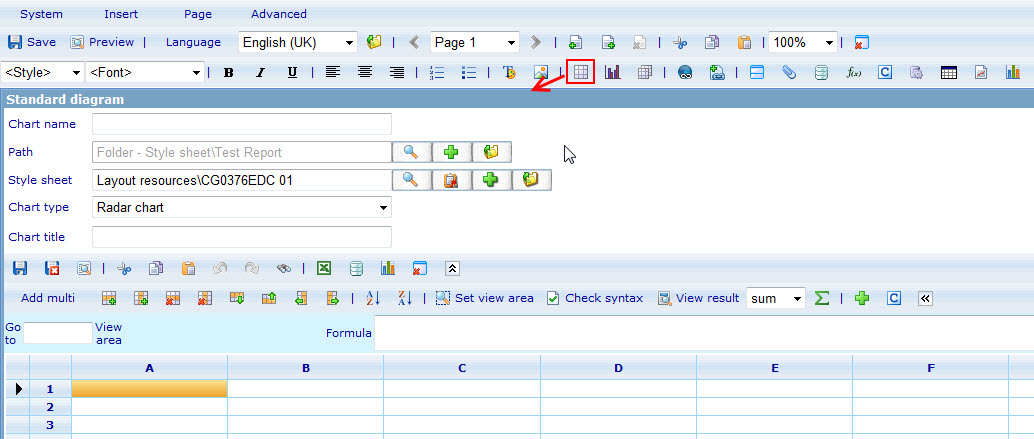
- In report template, click button "Insert chart" to insert standard diagram
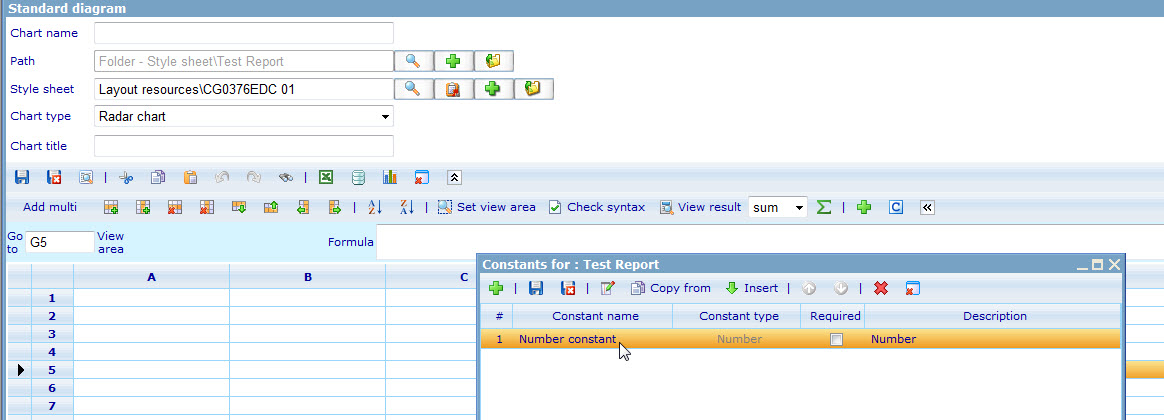
- Click on button "C" to open template constant
- Highlight a constant and insert to chart
- A constant was inserted to chart
- Edit anything in diagram as you want and save chart
- Save Report template
- Highlight the report and view it in order to see constant value in chart
![]() Note: You cannot see constant value if you preview Report template.
Note: You cannot see constant value if you preview Report template.


