SetTotalAsSum: Difference between revisions
From Catglobe Wiki
More actions
No edit summary |
No edit summary |
||
| (2 intermediate revisions by 2 users not shown) | |||
| Line 1: | Line 1: | ||
{{HelpFiles}} | |||
===== setTotalAsSum ===== | |||
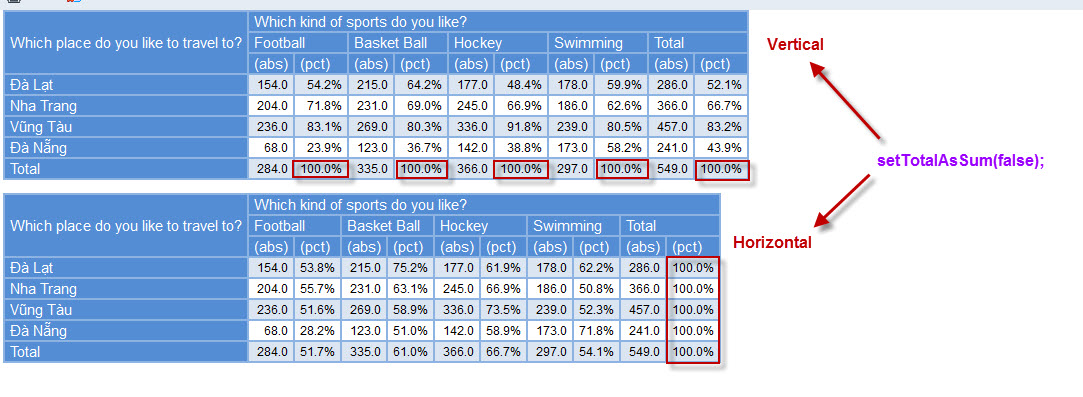
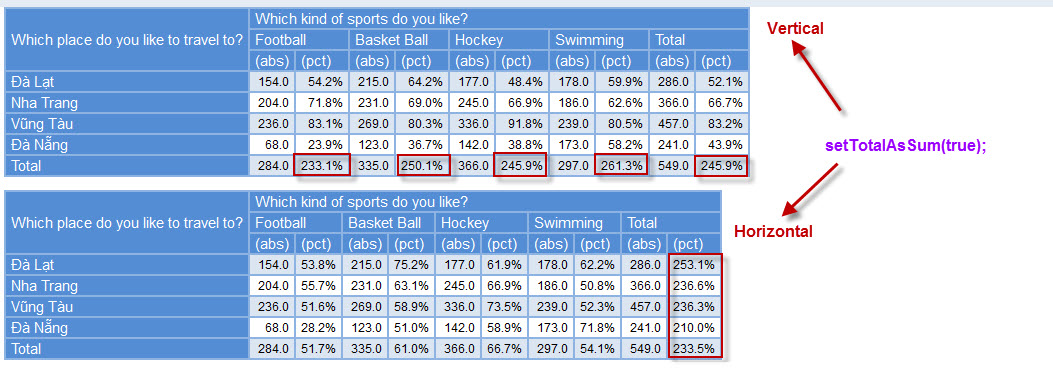
Returns the total percentage values (should be sum of pct values OR always is 100%), which can be shown for table diagrams. The values tells us percentage of answers were given to the question. This may be the same as the total percentage values, but given that the question type is MULTI, it may also be that it was more than this, since each respondent then can give more than one answer to one question. | |||
'''Syntax''' | |||
setTotalAsSum(enabled); | |||
'''Arguments''' | |||
enabled: Is a boolean expression (true / false). | |||
'''Return type''' | |||
empty | |||
'''Examples''' | |||
[[Image:SetTotalAsSum(true).jpg]] | {| width="300" cellspacing="1" cellpadding="1" border="1" | ||
|- | |||
| valign="middle" align="center" | '''Scripts''' | |||
| valign="middle" align="center" | '''Results''' | |||
|- | |||
| | |||
''setTotalAsSum(false);'' | |||
''setDirection(Diagram_DirectionType_Vertical); '' | |||
''createCrossDiagram({"Q1"},{"Q11"});'' | |||
''setDirection(Diagram_DirectionType_Horizontal); '' | |||
''createCrossDiagram({"Q1"},{"Q11"});'' | |||
| [[Image:SetTotalAsSum(false).jpg]] | |||
|- | |||
| | |||
''setTotalAsSum(true);'' | |||
''setDirection(Diagram_DirectionType_Vertical); '' | |||
''createCrossDiagram({"Q1"},{"Q11"});'' | |||
''setDirection(Diagram_DirectionType_Horizontal); '' | |||
''createCrossDiagram({"Q1"},{"Q11"});'' | |||
| [[Image:SetTotalAsSum(true).jpg]] | |||
|} | |||
'''Availability''' | |||
Version 5.8.1 __NOTOC__ <!-- imported from file: 8134.htm--> | |||
[[Category:TotalAsSum_functions]] | [[Category:TotalAsSum_functions]] | ||
Latest revision as of 09:55, 27 December 2011
setTotalAsSum
Returns the total percentage values (should be sum of pct values OR always is 100%), which can be shown for table diagrams. The values tells us percentage of answers were given to the question. This may be the same as the total percentage values, but given that the question type is MULTI, it may also be that it was more than this, since each respondent then can give more than one answer to one question.
Syntax
setTotalAsSum(enabled);
Arguments
enabled: Is a boolean expression (true / false).
Return type
empty
Examples
Availability
Version 5.8.1


