Tabulation setFilterHeaderText: Difference between revisions
From Catglobe Wiki
More actions
No edit summary |
No edit summary |
||
| (3 intermediate revisions by 2 users not shown) | |||
| Line 1: | Line 1: | ||
{{HelpFiles}} | |||
==== Tabulation_setFilterHeaderText ==== | ==== Tabulation_setFilterHeaderText ==== | ||
| Line 17: | Line 19: | ||
'''Example''' | '''Example''' | ||
Tabulation_setTableLayout(TableChartLayout_Ifka); | {| width="200" cellspacing="1" cellpadding="1" border="1" | ||
|- | |||
| valign="middle" align="center" | '''Script''' | |||
| valign="middle" align="center" | '''Result''' | |||
|- | |||
| | |||
''Tabulation_setTableLayout(TableChartLayout_Ifka);'' | |||
''Tabulation_setAbsText("abs");'' | |||
''Tabulation_setPctText("%");'' | |||
''Tabulation_setTotalText("Resp.");'' | |||
''Tabulation_setMergeStatisticPctItem(true);'' | |||
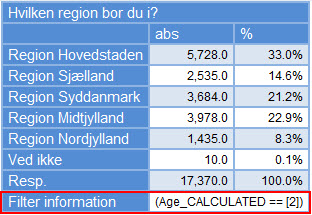
''addFilter("Age_CALCULATED == [2]");'' | |||
''createFrequenceDiagram("- - Region");'' | |||
| [[Image:AddFilter.jpg]]<br> | |||
|- | |||
| | |||
''Tabulation_setTableLayout(TableChartLayout_Ifka);'' | |||
''Tabulation_setAbsText("abs");'' | |||
''Tabulation_setPctText("%");'' | |||
''Tabulation_setTotalText("Resp.");'' | |||
''Tabulation_setMergeStatisticPctItem(true);'' | |||
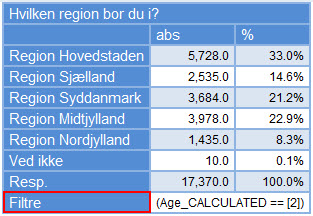
''Tabulation_setFilterHeaderText("Filtre");'' | |||
''addFilter("Age_CALCULATED == [2]");'' | |||
''createFrequenceDiagram("- - Region");'' | |||
| [[Image: | |||
| [[Image:Tabulation setFilterHeaderText.jpg]]<br> | |||
|} | |} | ||
{{note}} This function should be paired with [http://wiki.catglobe.com/index.php/AddFilter-Filter_functions addFilter]. | |||
'''Availability''' | '''Availability''' | ||
Latest revision as of 07:33, 29 December 2011
Tabulation_setFilterHeaderText
Set text to Filter header
Syntax
Tabulation_setFilterHeaderText(text)
Arguments
- text: is string
Return value
empty
Example
![]() Note: This function should be paired with addFilter.
Note: This function should be paired with addFilter.
Availability
Version 5.8.1


