SetSortMode: Difference between revisions
From Catglobe Wiki
More actions
Nguyenduyan (talk | contribs) No edit summary |
Nguyenduyan (talk | contribs) No edit summary |
||
| (One intermediate revision by the same user not shown) | |||
| Line 21: | Line 21: | ||
== Example == | == Example == | ||
<source lang="javascript"> | <source lang="javascript"> | ||
DCS_use(15593723); | DCS_use(15593723); | ||
Tabulation_setSortOrderVertical(Tabulation_SortOrder_HighToLow); | Tabulation_setSortOrderVertical(Tabulation_SortOrder_HighToLow); | ||
// | Tabulation_setSortVerticalWhichColumn(0); | ||
//setSortMode(Diagram_SortDataType_Absolute); | |||
setSortMode(Diagram_SortDataType_Percentage); | setSortMode(Diagram_SortDataType_Percentage); | ||
createCrossDiagram({"DD_Region"}, {"D_Gender"}); | createCrossDiagram({"DD_Region"}, {"D_Gender"}); | ||
</source> | </source> | ||
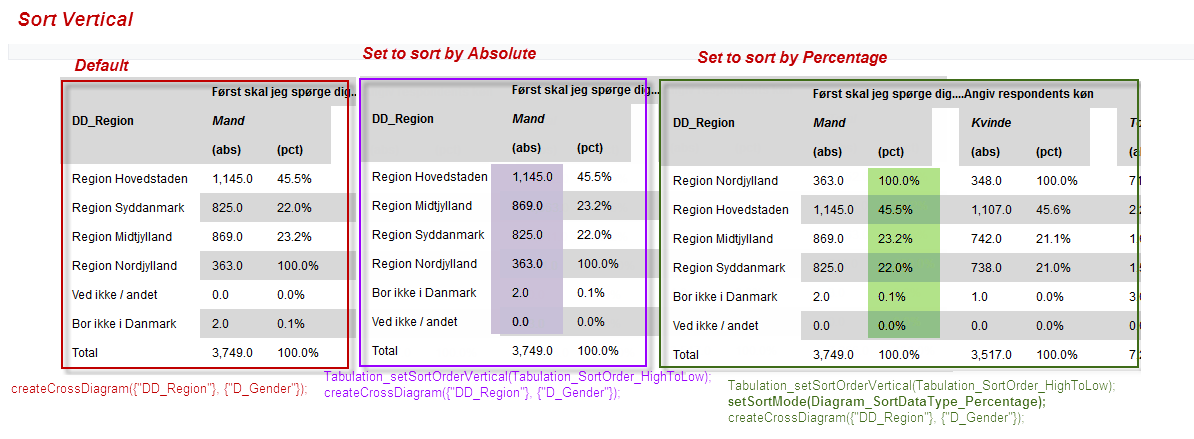
[[File:Sortvertical.png]] | |||
[[File: | <source lang="javascript"> | ||
DCS_use(15593723); | |||
Tabulation_setSortOrderHorizontal(Tabulation_SortOrder_HighToLow); | |||
Tabulation_setSortHorizontalWhichColumn(0); | |||
//setSortMode(Diagram_SortDataType_Absolute); | |||
setSortMode(Diagram_SortDataType_Percentage); | |||
createCrossDiagram({"DD_Region"}, {"D_Gender"}); | |||
</source> | |||
[[File:SortHorizontal.png]] | |||
Latest revision as of 03:29, 9 November 2017
setSortMode
Define which data should be sorted (absolute or percentage data)
Syntax
setSortMode(sortDataType);
Arguments
sortDataType: is a number expression. It's one of the constants specified below:
- 1: Diagram_SortDataType_Absolute
- 2: Diagram_SortDataType_Percentage
Return type
Empty
Example
DCS_use(15593723);
Tabulation_setSortOrderVertical(Tabulation_SortOrder_HighToLow);
Tabulation_setSortVerticalWhichColumn(0);
//setSortMode(Diagram_SortDataType_Absolute);
setSortMode(Diagram_SortDataType_Percentage);
createCrossDiagram({"DD_Region"}, {"D_Gender"});
DCS_use(15593723);
Tabulation_setSortOrderHorizontal(Tabulation_SortOrder_HighToLow);
Tabulation_setSortHorizontalWhichColumn(0);
//setSortMode(Diagram_SortDataType_Absolute);
setSortMode(Diagram_SortDataType_Percentage);
createCrossDiagram({"DD_Region"}, {"D_Gender"});


