Tabulation setShowTotalRespondents: Difference between revisions
More actions
No edit summary |
No edit summary |
||
| Line 29: | Line 29: | ||
''//Result: Total respondents row is enabled and can be shown for table diagrams.'' | ''//Result: Total respondents row is enabled and can be shown for table diagrams.'' | ||
'' | ''number a = createFrequenceDiagram("Civil_status");'' | ||
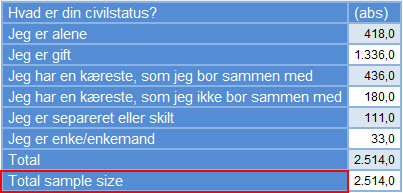
[[Image:SetShowTotalRespondent.jpg]]<br> | |||
'''Availability''' | '''Availability''' | ||
Latest revision as of 09:54, 29 December 2011
Tabulation_setShowTotalRespondent
Enables or disables the show total respondents row in table diagrams. This row is a statistical row shown at the bottom of the table.
Syntax
Tabulation_setShowTotalRespondent(enabled)
Arguments
enabled: Is a boolean expression. If true the row will be included, if false the row will not be included
Return type
empty
Examples
Tabulation_setShowTotalRespondent(true);
bool b = Tabulation_getShowTotalRespondent();
if (b) print("Total respondents row is enabled and can be shown for table diagrams.");
else print("Total respondents row is disabled and cannot be shown for table diagrams.");
//Result: Total respondents row is enabled and can be shown for table diagrams.
number a = createFrequenceDiagram("Civil_status");
Availability
Version 5.8.1

