Color the graph area: Difference between revisions
From Catglobe Wiki
More actions
jrfconvert import |
No edit summary |
||
| Line 1: | Line 1: | ||
[[Category: | [[Category:Graph area]] | ||
| | ||
Revision as of 08:09, 29 March 2011
Color the graph area
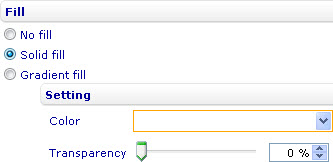
To color the graph area in a bar line, area, point, bubble, radial gauge, or box and whiskers chart through the External Style Sheet and Inline Style Sheet editors:
- Under Graph area, select Graph fill, and then find the Fill group of settings on the right-hand area.
- Use the provided settings to color the graph area the way you want.

