Dashboard element - static diagram: Difference between revisions
More actions
No edit summary |
No edit summary |
||
| Line 1: | Line 1: | ||
[[Category:Layout tab - The dashboard editor]] | [[Category:Layout tab - The dashboard editor]] | ||
| {{HelpFiles_Report_Module}} | ||
====Dashboard element - static diagram==== | ====Dashboard element - static diagram==== | ||
Latest revision as of 08:48, 13 December 2011
Dashboard element - static diagram
Usage: This element generates information to show on a dashboard.
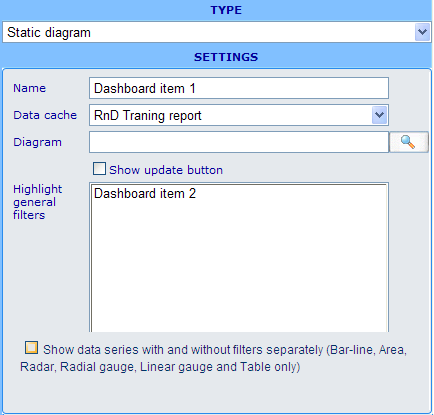
Example of editor format:
Settings in editor format: Besides the name field we have the following specific choices.
Data cache: You will be required to choose a data cache that is also used by the diagram you choose in the field below it. This is a validation measure to ensure that the general filters that you relate to the diagram are using the same axis set.
Diagram: Here you must choose a standard diagram that you want to be shown in the dashboard. This diagram must be using the same data cache as the one you chose in the element's data cache drop down.
Show update button: When this check box is not ticked, then this diagram will be regenerated each time any of its related filters are changed. If ticked then an update button will be shown on top of the diagram in the viewer. The diagram will then only be regenerated and related viewable filters only take effect when this button is clicked.
Highlight general filters: All elements in the dashboard of the types viewable advanced filter, viewable simple filter, hidden filter, viewable weight and hidden weight will then be listed. To choose which of these filters that will have an effect on the diagram you need to highlight them on this list. When an element is highlighted then it will influence the results of the diagram element regardless of it being viewable or hidden. Difference is that you can in the dashboard viewer change settings in the viewable elements and hereby update the results of the diagram according to user wishes.
With and without filters: Doubles the number of series that will be shown in the diagram. Half will be shown using the above mentioned generak filters - the other half will not. The legend will indicate which series is being filtered.
Other elements that can utilize this element:
None - this element just uses other elements but has no filters or axes that it can send to other elements.
Example of viewable format:
- Notice the "Update" button on top of the diagram. This button only appears when the "Show update button" is ticked off for the element.
- The size of the diagram depends on the style sheet that the diagram is using. Please update style sheet if you want to change any graphical settings of a diagram.


