Report viewer request: Difference between revisions
More actions
No edit summary |
No edit summary |
||
| Line 1: | Line 1: | ||
<accesscontrol>Administrators,,Cem,,Maysunshine</accesscontrol> | <accesscontrol>Administrators,,Cem,,Maysunshine</accesscontrol> | ||
[[Category: | [[Category:Miscellaneous]] | ||
== Report viewer request == | == Report viewer request == | ||
Revision as of 11:36, 24 October 2011
<accesscontrol>Administrators,,Cem,,Maysunshine</accesscontrol>
Report viewer request
One of the very important technical considerations in terms of reports is the fact that there actually exists two quite different editors with three different viewers for three different report types. These editors and viewers are:
- Presentation editor's templates can be shown in the presentation viewer
- Document editor's templates can be shown in the document viewer or PDF viewer
Although all three may (unfortunately) have been separated too much from each other code and object wise; then I will nonetheless explain all three as if they were using the same structure, since this is what they ought to do as much as possible. The business logic ought also be very similar and any differences can most likely be seen as bugs.
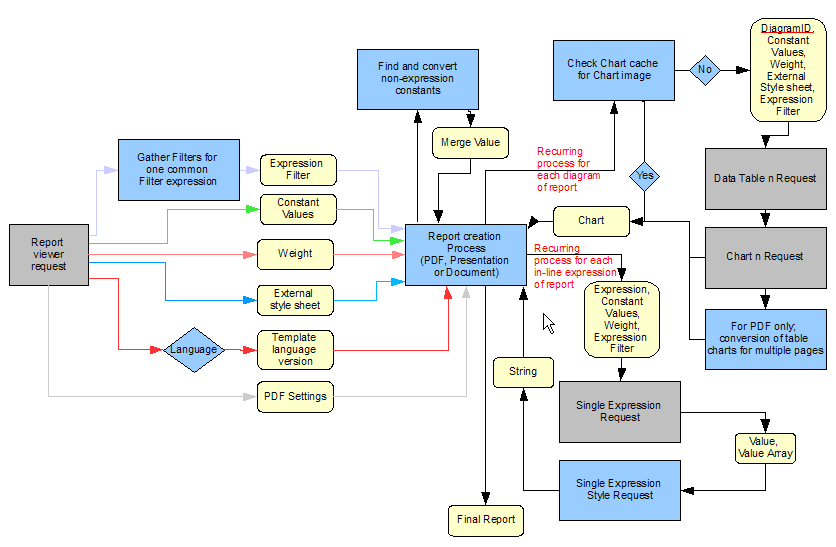
Illustration 5: Report viewer request model
Before explaining each sub part in detail it will easy the understanding of what you will be told in this chapter if I shortly explain the above model.
Basically we may have a report viewer request started. We will not make an additional model for viewing reports via the two template editors (presentation and documentation), since these are almost similar. Differences are:
- Report Templates do NOT send parameters for Expression Filter, Constant Values, Weight, and External Style Sheet.
- It is not possible to see PDF reports from the Report Template viewer.
For the sake of simplicity I support that we do not allow Expression Filters, Weights and External Style Sheets to belong to report templates. It would although be an okay extension in the future to allow users to see PDF versions from the document template editor.
From the template the report creation process will receive a template (either presentation or document) and since this template may exist in more language versions, one of these language versions must be chosen. This is done by the report viewer process that finds out what language version the viewer is interested in looking at the report in. If we wish to see a document report as PDF instead of in the standard document viewer, then we also send PDF settings together with the report viewer request.
There can be several filters on reports that need to be combined into one common filter to be given to the diagram. This is handled in the “Gather filters for one common filter expression” action.
Once the report creation process has gathered all these information it is ready to start the process of actually generating the final report. Some processes are exactly the same, no matter which type of report is being made.
Convert non expression constants finds all those constants that have been placed in the report which are not expressions and replaces them with the value received from the report.
Then each diagram and in the Template Language version goes through a chart caching check. This is a feature in the report module that ensures that any historical image already made for the diagram is cached, so that if another request is made later for a diagram, that was exactly the same as an earlier one, then the image of the earlier one will just be reused.
If there is no chart image in cache (or image is out of date) then it goes through first the Data Table Request and then the Chart Request and returns the chart to the Report Creation Process that places the chart where the diagram insert was in the report.
In the same way all Single Expressions go through the Single Expression Request, are then set up using accompanying styles using the Single Expression Style Request, and the resulting string is then inserted into the Report.
The Report Creation Process finally also interprets the template language version that it has received and according to three very different logics creates the final report.
A major difference between the three final formats is here, that the PDF and Presentation formats are completely created server side before being handed over to the client side. The document viewer on the other hand will first create the final report (including non expression constants and Single Expressions) and then send this to the client. As it gradually finishes the charts it will send them to the client that will put them into the page the user is watching. Notice that document reports can be placed on multiple pages, thus ensuring faster viewing, by only having to create pages that are viewed.
Now that I have given a quick overview of the general process we are ready to look at the major steps of the process in more detail.
Gather filters for one common filter expression
There is various ways in which filters can be added to a report and many of them can actually be applied at the same time. Therefore, these filters need to be combined into one common “Expression Filter” before being sent on to the Report Creation Process. This chapter will introduce all the different places where filters can be applied.
Report “Basic filters”
This filter is specified on the report resource dialog.
It is possible to add several filters so each of these must be added to the common filter expression.
Report “Hidden filters”
This filter depends on whom the viewer is.
It is a list of filters that are each related to a user or group. When a report viewer request is being carried out, then the system will check if the user is member of the first (top of list) group/user. If he is then that filter will be applied to the common expression filter and the system will stop testing any filters further down the list (I.e. only one hidden filter can be used at a time for a report viewing). If the user is not member of the first hidden filter then the system will continue to the second one and make the same test until the end of the list is reached. If the user was not member of any of the hidden filters then none of these will be applied. NB: Notice that hidden filters can also be applied to Cross, Tracking, Comparison and Campaign diagrams.
Report types
There are three possible settings for “Report type”. These can be applied to both Document (incl. PDF) and Presentation. Standard will not add any additional filter to a report.
On the other hand, both Personal and Dynamic Report Types will/may add additional filters to the common expression filter. Since these may change from time to time then Diagrams that belong to reports that are of the type “Personal” and “Dynamic” will never be cached.
Report type “Personal report”
When viewing a personal report the Report Viewer will find out who is watching and then user the ID of that person(<loggedInUser>) in a filter to be added to the common Expression Filter. This expression will be “User_Id == <loggedInUser>”. It assumes that the data cache which is being used with the personal report has a User_Id column. If it does not then all diagrams of the report will be without data. Personal reports are used so that respondents can get a report of what they themselves answered.
Report type “Dynamic report”
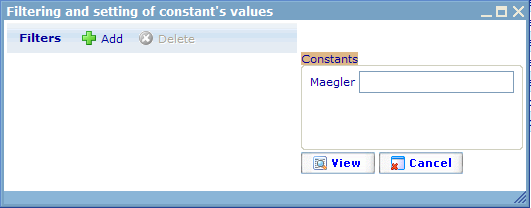
The first thing that the report viewer will do when a user views a report of the type “Dynamic” is to present that user with a “Filter choice dialog” as shown below.
Here the user can specify additional filters he or she would like to apply to the report about to be viewed. By default filters from the reports “Basic filters” will be proposed. Any added filters will be combined with other existing filters (except the “Basic Filters” which will be ignored since they are just used as default values) into the Common Filter Expressions.
Notice that user in this type of report will also be offered to define constant values to be used in the report. Any existing value for constants shown will be offered as defaults.
Language – Template Language Version
Diagrams are not related directly to Report Templates. They are actually related to a table in between Diagram and Report Template tables called “Report Language”... more appropriate name would probably have been “Report Template Language”. So basically “Report Language” versions may have very little in common since every bit of information, diagrams, etc. in them may be different.
It is in the report creation phase therefore extremely important to tell the “report creation process” which report language version to use.
There is always one language version set as default. When viewing a report from the resource list the system will try to figure out which language the user should be sent; if the user's language exists among the report language versions, then that version will be used. If not, the default version will be used.
PDF Settings
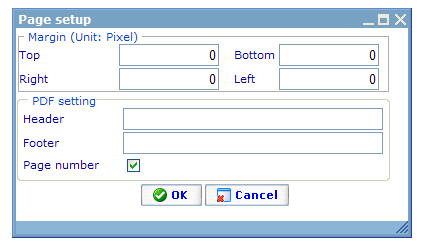
It is only from the report resource list that it is possible to view document reports as PDF. PDF settings can be set up for templates inside the document editor, in the dialog called “Page setup”.
These settings will be sent to the Report Creation Process each time the report is viewed as PDF.
They will not be applied when viewing a report as document and presentation.
Find and convert non-expression constants
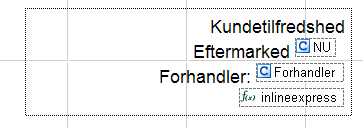
It is possible to insert constant merge fields directly into the two report editors. These are in other words not inserted as part of a Single Expression. There is no need to send these non-expression constants to the expression converter, so when viewing the report the will immediately be replaced with the constant value from the report. Below is an example of how two constants have been inserted directly into the text of a presentation.
Notice that there is also an Single expression lowest in the image to show the difference.
Check chart cache for chart image
All diagram images in the diagram cache can be used if they exist. The way that we ensure that there are never out of date chart images in the chart cache is to delete these images when certain actions happen in the system that will render them outdated.
Cached images exist related both to diagrams viewed directly from the presentation editor as well as diagram images related to reports of both presentation and document (incl. PDF) types. The reason to also have images for the diagrams viewed directly in the presentation editor is that this is one of the places where the benefit is the highest, since users are often quickly moving between slides and do not want to wait for the chart images to be generated each time.
PDF Conversion of Table charts for multiple pages
The problem with the PDF viewer compared to the document viewer is that it offers limited space for each page. This is often a problem for table diagrams that may have lots of rows and columns.
A number of changes have been implemented to make the final PDF looker nicer; all of these made by Mr. Long during the last 2-3 versions. There exists very little design for these changes and corrections (they were urgent fixes) so I will just list the major things that were done to tables.
- A simple logic was made to ensure that more than just one diagram was shown on each page. If there was room for 3-4 table diagrams on a page they were put together. The “estimation” logic for this is very simple and the final result thus not perfect – but better than the previous system which often created PDF files that were 100s of pages long. This was unacceptable compared to the more compact reports of competitors like Diana.
- If a diagram was estimated to be very big it was always started on a new page.
- If a diagram had so many columns that they could not fit on one page's width the table would be split into more columns. The row “headers” would be copied over to each additionally needed page.
- A feature was implemented on the report document editor that enabled the user to specify that certain pages of a PDF were to be “landscape” and others “portrait”. This supported better possibilities in making the final reports look good. (Notice the introduction of this called for more flexible estimations of what could fit on a page depending on whether that page was portrait or landscape.
- Forcing of similar column widths for all tables in a PDF report were initiated. Still is the focus that tables and diagrams in PDF reports should follow the style sheet settings as much as possible.
Concerning parameters given to the Data Table Request / Chart Request
As have also be mentioned earlier in each of these Request descriptions, the parameters that the Data Table Request and Chart Request are given will be combined/compared as to decide what the final parameters should be.
Data Table Request
- When a weight does not exist inside the diagram then any weight supplied from 'externally' will be used. If none exist both places no weight will be used.
- Constant values are always collected from 'externally'. If a constant is missing that exists in the expression table then the constant is replaced with “null”.
- Any 'expression filter' that is supplied from 'externally' should be combined into one with any diagram 'expression filters' that may exist Data Chart Request If a diagram does not have an 'external style sheet' related to it, then it will use the external style sheet provided to it from 'externally'. If there does not exist such a style sheet then the system style sheet will be used as the 'external style sheet'.
Concerning parameters given to the single expression request.
In the exact same way as with the chart creation requests, the parameters that the Single Expression Request are given will be combined/compared as to decide what the final parameters should be.
Single Expression Style Request
In a similar manner to the way that diagram can have applied style sheets, single expressions can actually also have styles set. These are although always placed on the expression itself (you could call them 'in-line) and cannot be shared (are never external).
It is easiest to explain the available styles by showing the single expression editor that can be used from the document and presentation editors.
As can be seen the font of the value or value array can be set; and even more importantly you can choose whether each item in a value array should be shown on Individual lines or in one long string. Especially when choosing the latter you should choose a separator that make results easy to segregate from each other.
Report creation process
Since I will later describe Presentation, and Document formats in more detail, the report creation process will here be described very superficially. PDF will although be discussed some more since it will not be discussed other places in this document.
Presentations made in Catglobe are viewed as Power Points. The component we are using to create these is called Aspose.Slides. The viewer takes a slide by slide approach. So basically it collects all the needs for conversion on one slide (non-expression constants, single expressions and charts) and requests these converted and then continues to the next slide. The requesting user is shown the process of each slide being generated by which element (diagrams only?4) has been done.
When the generation process has finished he will be offered to download the presentation.
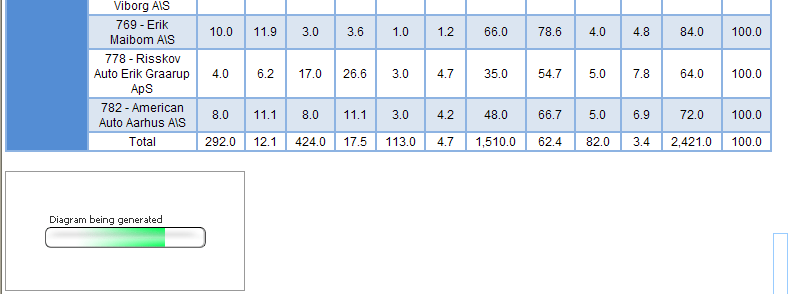
Document reports work in a different order. They are presented as HTML and initially Page 1 of the document report will be shown to the requesting user (after all Non-Expression Constants and Single Expressions have been converted and inserted), but without charts inserted. Instead of each chart will be a small replacement image stating that the chart is now in the process of being created. The server will then continue working and then “send” the image to the report as soon as it has finished. The user's report will thus generate while looking. It will continue generating charts for other pages than page 1, even though the user is still looking at page 1, so that these charts will be read when he “turns the pages”.
Although PDF is using the same XML source as document reports, it has it's own personal interpretation logic of this XML that fits the object conversion needs to the external PDF component we use called Aspose.PDF.
PDF's are very important to the research business, since most expect being able to use the quick report or instant report to quickly create a report and get the results in PDF without much work (using presentation and document editors are a lot of work).
Although improvements to the final PDF format have been done it still suffers massively from bad business analysis, bad design, and bad coding. An example of how it very often goes wrong is shown below (v5.6 – first one I tried :S):
Values are placed in wrong columns, usage of PDF pages are not optimized, etc.
One of the most important discussions/considerations here are:
- To what extend should the final PDF report follow the style sheet for that report (I.e. how closely should the document report resemble the document report)? I personally believe that the PDF component should have a lot of freedom in regards to table charts. It is in my opinion the only way we can make it work anywhere close to Diana. Let us look at how efficiently data is presented in Diana PDF.
I believe how this works and how we interpret the document XML when converting to PDF is one of the highest priority refactoring areas for the report team. When downloading PDF's the user will first be asked for the language he wishes to see it in.
After having chosen this the server will be working (user cannot see progress) and when finished the following dialog turns up.

