Tabulation setDiagramStyle: Difference between revisions
More actions
No edit summary |
No edit summary |
||
| Line 1: | Line 1: | ||
= Tabulation_setDiagramStyle = | |||
Sets the style for part of a chart. | Sets the style for part of a chart. | ||
| Line 14: | Line 12: | ||
TableDiagram_AllTable = 0 | TableDiagram_AllTable = 0 | ||
TableDiagram_QuestionHeader = 59 | |||
TableDiagram_ColumnHeader = 1 | TableDiagram_ColumnHeader = 1 | ||
Revision as of 08:10, 12 April 2012
Tabulation_setDiagramStyle
Sets the style for part of a chart.
Syntax
Tabulation_setDiagramStyle(styleType, diagramStyle)
Arguments
styleType: enumeration for the part of a chart you want to set. Below is the full list of chart style type enumerations:
TableDiagram_AllTable = 0
TableDiagram_QuestionHeader = 59
TableDiagram_ColumnHeader = 1
TableDiagram_ColumnHeaderLevel1 = 2
TableDiagram_ColumnHeaderLevel2 = 3
TableDiagram_ColumnHeaderLevel3 = 4
TableDiagram_ColumnHeaderLevel4 = 5
TableDiagram_RowHeader = 6
TableDiagram_RowHeaderLevel1 = 7
TableDiagram_RowHeaderLevel2 = 8
TableDiagram_RowHeaderLevel3 = 9
TableDiagram_AnswerRow = 10
TableDiagram_AnswerRowAlternate = 11
TableDiagram_AbsoluteColumn = 12
TableDiagram_AbsoluteColumnHeader = 13
TableDiagram_AbsoluteColumnValue = 14
TableDiagram_PercentageColumn = 15
TableDiagram_PercentageColumnHeader = 16
TableDiagram_PercentageColumnValue = 17
TableDiagram_TotalColumn = 18
TableDiagram_TotalColumnHeader = 19
TableDiagram_TotalColumnValue = 20
TableDiagram_TotalRow = 21
TableDiagram_TotalRowHeader = 22
TableDiagram_TotalRowValue = 23
TableDiagram_VarianceRow = 24
TableDiagram_VarianceRowHeader = 25
TableDiagram_VarianceRowValue = 26
TableDiagram_AverageRow = 27
TableDiagram_AverageRowHeader = 28
TableDiagram_AverageRowValue = 29
TableDiagram_StdDevRow = 30
TableDiagram_StdDevRowHeader = 31
TableDiagram_StdDevRowValue = 32
TableDiagram_StdErrorRow = 33
TableDiagram_StdErrorRowHeader = 34
TableDiagram_StdErrorRowValue = 35
TableDiagram_MedianRow = 36
TableDiagram_MedianRowHeader = 37
TableDiagram_MedianRowValue = 38
TableDiagram_QuantilesRow = 39
TableDiagram_QuantilesRowHeader = 40
TableDiagram_QuantilesRowValue = 41
TableDiagram_PercentileRow = 42
TableDiagram_PercentileRowHeader = 43
TableDiagram_PercentileRowValue = 44
TableDiagram_SignificanceRow = 45
TableDiagram_SignificanceRowHeader = 46
TableDiagram_SignificanceRowValue = 47
TableDiagram_CountAnswerRow = 48
TableDiagram_CountAnswerRowHeader = 49
TableDiagram_CountAnswerRowValue = 50
TableDiagram_TotalRespondentRow = 51
TableDiagram_TotalRespondentRowHeader = 52
TableDiagram_TotalRespondentRowValue = 53
diagramStyle: diagram style object want to apply. It is an array with the following constants.
|
Constant |
Type |
Initial/Default value |
Description |
|
OBJECT_TYPE |
Number |
21 |
Enumeration defining the object type. |
|
TABLE_DIAGRAM_STYLE_FILL |
Array |
As set in the object |
Fill style. Background color. |
|
TABLE_DIAGRAM_STYLE_DECIMAL |
Number |
As set in the object |
Decimal place. |
|
TABLE_DIAGRAM_STYLE_FONT |
Array |
As set in the object |
Font. |
|
TABLE_DIAGRAM_STYLE_VALIGN |
String |
As set in the object |
Vertical alignment (allows values "top", "center", or "bottom"). |
|
TABLE_DIAGRAM_STYLE_HALIGN |
String |
As set in the object |
Horizontal alignment (allows values "left", "center", or "right"). |
Return type
Empty
Examples
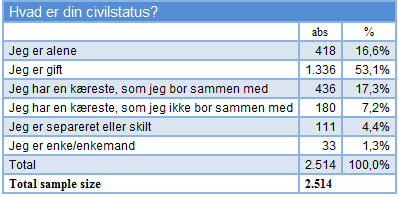
Tabulation_setTableLayout(TableChartLayout_Ifka);
Tabulation_setAbsText("abs");
Tabulation_setPctText("%");
Tabulation_setCountAnswer(true);
Tabulation_setTotalAnswerText("Total sample size");
Tabulation_setEnableOddEvenRowHeader(true);
Tabulation_setMergeStatisticPctItem(true);
//set values for Abs column
array font = {18,"Times New Roman",9,{17,0,0,0},false,false,false,true};
array fill_AbsCol = {19,{17,0,0,0},2,true};
string valign = "center";
string halign_AbsCol = "right";
number decimal = 0;
array diagramStyle_AbsCol={21,fill_AbsCol,decimal,font,valign,halign_AbsCol};
Tabulation_setDiagramStyle(TableDiagram_AbsoluteColumn,diagramStyle_AbsCol);
//set values for Count Answer Row
array font_CountAnswer = {18,"Times New Roman",9,{17,0,0,0},true,false,false,false};
string halign_CountAnswer = "left";
array diagramStyle_CountAnswer ={21,fill_AbsCol,decimal,font_CountAnswer,valign,halign_CountAnswer};
Tabulation_setDiagramStyle(TableDiagram_CountAnswerRow,diagramStyle_CountAnswer);
//set values for Headers column
array font_Header = DiagramFontStyle_getDefault();
font_Header[DIAGRAM_FONT_STYLE_COLOR] = Color_getByRGB("#000000");
font_Header[DIAGRAM_FONT_STYLE_FACE] = "Times New Roman";
font_Header[DIAGRAM_FONT_STYLE_SIZE] = 9 ;
array fill_style = DiagramFillStyle_getDefault();
array style_header = Tabulation_getDefaultDiagramStyle(Diagram_Type_Table);
style_header[TABLE_DIAGRAM_STYLE_FILL] = fill_style;
style_header[TABLE_DIAGRAM_STYLE_FONT] = font_Header;
style_header[TABLE_DIAGRAM_STYLE_VALIGN] = "center";
style_header[TABLE_DIAGRAM_STYLE_HALIGN] = "center";
Tabulation_setDiagramStyle(TableDiagram_ColumnHeaderLevel2, style_header);
Tabulation_setDiagramStyle(TableDiagram_AbsoluteColumnHeader, style_header);
Tabulation_setDiagramStyle(TableDiagram_PercentageColumnHeader, style_header);
createFrequenceDiagram("Civil_status");

Availability
Version 5.8.1
