Difference between revisions of "Tabulation setTotalColumnVisibility"
| Line 17: | Line 17: | ||
'''Examples''' | '''Examples''' | ||
| − | + | <span style="color:#DF8621"> Example for cross 1x1 </span> | |
| + | <source lang="javascript"> | ||
| + | DCS_use(15639259); | ||
| + | Tabulation_setTotalColumnVisibility(false); | ||
| + | createCrossDiagram({"Gender"},{"Age"}); | ||
| + | </source> | ||
| + | [[File:2018-11-12_10-31-07.png]] | ||
| − | |||
| − | + | <span style="color:#DF8621"> Example for cross 1x2 </span> | |
| − | + | <source lang="javascript"> | |
| − | + | DCS_use(15639259); | |
| − | [[ | + | Tabulation_setTotalColumnVisibility(false); |
| + | createCrossDiagram({"Gender"},{"Age","Q3"}); | ||
| + | </source> | ||
| + | [[File:2018-11-12_10-41-06.png]] | ||
Revision as of 04:47, 12 November 2018
Tabulation_setTotalColumnVisibility
Show/hide the total column.
Syntax
Tabulation_setTotalColumnVisibility(a);
Arguments
a: Is a Boolean expression.
Return type
empty
Examples
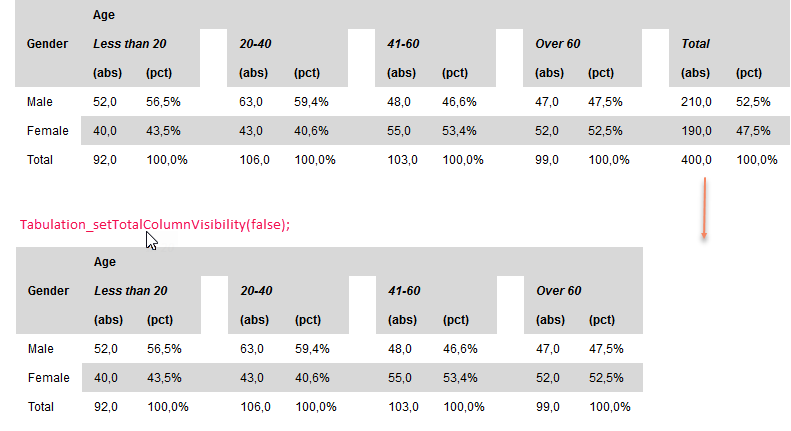
Example for cross 1x1
DCS_use(15639259);
Tabulation_setTotalColumnVisibility(false);
createCrossDiagram({"Gender"},{"Age"});
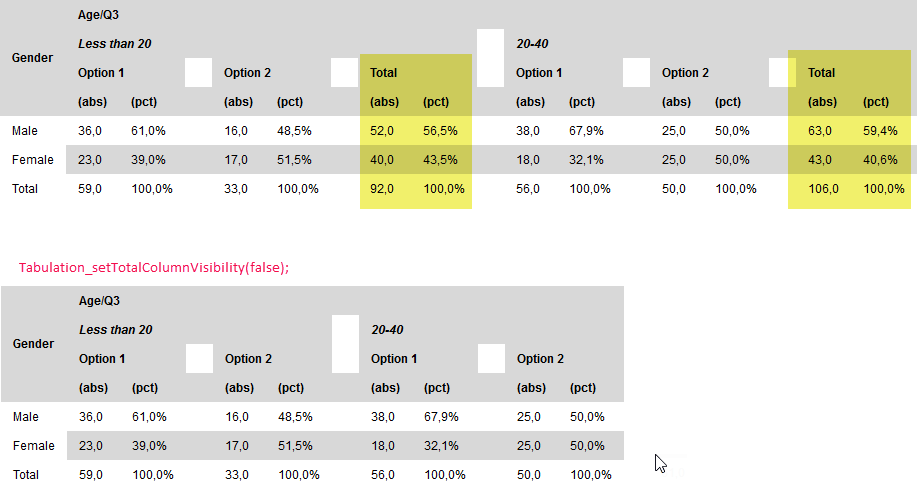
Example for cross 1x2
DCS_use(15639259);
Tabulation_setTotalColumnVisibility(false);
createCrossDiagram({"Gender"},{"Age","Q3"});

