Tabulation setTotalRespondentText: Difference between revisions
More actions
No edit summary |
No edit summary |
||
| Line 1: | Line 1: | ||
{{HelpFiles}} | {{HelpFiles}} | ||
===== Tabulation_setTotalRespondentText ===== | ===== Tabulation_setTotalRespondentText ===== | ||
Set the text for the total respondent row, which is one of the statistical rows that can be shown for tables. If this function is not used then the label for the row will just be the default value "Total sample size". | Set the text for the total respondent row, which is one of the statistical rows that can be shown for tables. If this function is not used then the label for the row will just be the default value "Total sample size". | ||
| Line 19: | Line 19: | ||
'''Example''' | '''Example''' | ||
''setShowMode(Diagram_ShowModeType_Absolute);'' | ''setShowMode(Diagram_ShowModeType_Absolute);'' | ||
''Tabulation_setShowTotalRespondent(true);'' | ''Tabulation_setShowTotalRespondent(true);'' | ||
''number a = createFrequenceDiagram("Civil_status"); '' | ''number a = createFrequenceDiagram("Civil_status"); '' | ||
''//Result: Text of Total respondent row is "Total sample size".'' | ''//Result: Text of Total respondent row is "Total sample size".'' | ||
'' | ''[[Image:SetShowTotalRespondent.jpg]]'' | ||
'' | ''Tabulation_setTotalRespondentText("Total respondents"); '' | ||
'' | ''a = createFrequenceDiagram("Civil_status"); '' | ||
''{{note}} This function should be paired with function [http://wiki.catglobe.com/index.php?title=Tabulation_setShowTotalRespondents Tabulation_setShowTotalRespondents].'' | ''//Result: New text of Total respondent row is "Total respondents".'' | ||
''[[Image:SetTotalRespondentText.jpg]]'' | |||
''{{note}} This function should be paired with function [http://wiki.catglobe.com/index.php?title=Tabulation_setShowTotalRespondents Tabulation_setShowTotalRespondents].'' | |||
'''Availability''' | '''Availability''' | ||
Latest revision as of 10:03, 29 December 2011
Tabulation_setTotalRespondentText
Set the text for the total respondent row, which is one of the statistical rows that can be shown for tables. If this function is not used then the label for the row will just be the default value "Total sample size".
Syntax
Tabulation_setTotalRespondentText(text)
Arguments
text: is string
Return value
empty
Example
setShowMode(Diagram_ShowModeType_Absolute);
Tabulation_setShowTotalRespondent(true);
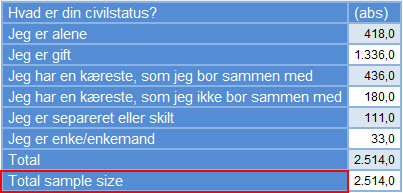
number a = createFrequenceDiagram("Civil_status");
//Result: Text of Total respondent row is "Total sample size".
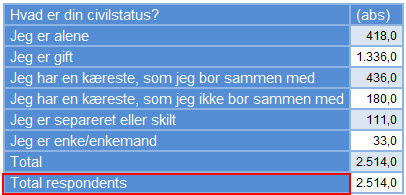
Tabulation_setTotalRespondentText("Total respondents");
a = createFrequenceDiagram("Civil_status");
//Result: New text of Total respondent row is "Total respondents".
![]() Note: This function should be paired with function Tabulation_setShowTotalRespondents.
Note: This function should be paired with function Tabulation_setShowTotalRespondents.
Availability
Version 5.8.1


