FixedCrossTable class: Difference between revisions
From Catglobe Wiki
More actions
No edit summary |
No edit summary |
||
| Line 1: | Line 1: | ||
{{CGscriptClass_Template | |||
|Name=FixedCrossTable | |||
|Description=A resource journal entry | |||
|Constructors= | |||
Result: | {{CGscriptConstructors_Template|Parameters= | ||
<br /> | {{CGscriptParameters_Template|Type=string|Name=rowTitle|Description=Title of row.|Comma=,}}{{CGscriptParameters_Template|Type=array|Name=primaryRowAxis|Description=Axis from Axis_xxx function for the primary row axis.|Comma=,}}{{CGscriptParameters_Template|Type=FixedCrossTableRowSeries|Name=rowSeries|Description=Data for the table.|Comma=,}}{{CGscriptParameters_Template|Type=array|Name=statisticsValues|Description=Array of StatisticsItems.}} | ||
|Description=Create new 1x0 FixedCrossTable.}} | |||
{{CGscriptConstructors_Template|Parameters= | |||
< | {{CGscriptParameters_Template|Type=string|Name=rowTitle|Description=Title of row.|Comma=,}}{{CGscriptParameters_Template|Type=array|Name=primaryRowAxis|Description=Axis from Axis_xxx function for the primary row axis.|Comma=,}}{{CGscriptParameters_Template|Type=array|Name=secondaryRowAxis|Description=Axis from Axis_xxx function for the secondary row axis.|Comma=,}}{{CGscriptParameters_Template|Type=array|Name=rowSeries|Description=Data for the table.|Comma=,}}{{CGscriptParameters_Template|Type=array|Name=statisticsValues|Description=Array of StatisticsItems.}} | ||
|Description=Create new 2x0 FixedCrossTable.}} | |||
Result: | {{CGscriptConstructors_Template|Parameters= | ||
<br /> | {{CGscriptParameters_Template|Type=string|Name=rowTitle|Description=Title of row.|Comma=,}}{{CGscriptParameters_Template|Type=array|Name=primaryRowAxis|Description=Axis from Axis_xxx function for the primary row axis.|Comma=,}}{{CGscriptParameters_Template|Type=string|Name=colTitle|Description=Title of column.|Comma=,}}{{CGscriptParameters_Template|Type=array|Name=primaryColAxis|Description=Axis from Axis_xxx function for the primary column axis.|Comma=,}}{{CGscriptParameters_Template|Type=array|Name=rowSeries|Description=Data for the table.|Comma=,}}{{CGscriptParameters_Template|Type=array|Name=statisticsValues|Description=Array of StatisticsItems.}} | ||
|Description=Create new 1x1 FixedCrossTable.}} | |||
< | {{CGscriptConstructors_Template|Parameters= | ||
{{CGscriptParameters_Template|Type=string|Name=rowTitle|Description=Title of row.|Comma=,}}{{CGscriptParameters_Template|Type=array|Name=primaryRowAxis|Description=Axis from Axis_xxx function for the primary row axis.|Comma=,}}{{CGscriptParameters_Template|Type=string|Name=colTitle|Description=Title of column.|Comma=,}}{{CGscriptParameters_Template|Type=array|Name=primaryColAxis|Description=Axis from Axis_xxx function for the primary column axis.|Comma=,}}{{CGscriptParameters_Template|Type=array|Name=secondaryColAxis|Description=Axis from Axis_xxx function for the secondary column axis.|Comma=,}}{{CGscriptParameters_Template|Type=FixedCrossTableRowSeries|Name=rowSeries|Description=Data for the table.|Comma=,}}{{CGscriptParameters_Template|Type=array|Name=statisticsValues|Description=Array of StatisticsItems.}} | |||
|Description=Create new 1x2 FixedCrossTable.}} | |||
{{CGscriptConstructors_Template|Parameters= | |||
{{CGscriptParameters_Template|Type=string|Name=rowTitle|Description=Title of row.|Comma=,}}{{CGscriptParameters_Template|Type=array|Name=primaryRowAxis|Description=Axis from Axis_xxx function for the primary row axis.|Comma=,}}{{CGscriptParameters_Template|Type=array|Name=secondaryRowAxis|Description=Axis from Axis_xxx function for the secondary row axis.|Comma=,}}{{CGscriptParameters_Template|Type=string|Name=colTitle|Description=Title of column.|Comma=,}}{{CGscriptParameters_Template|Type=array|Name=primaryColAxis|Description=Axis from Axis_xxx function for the primary column axis.|Comma=,}}{{CGscriptParameters_Template|Type=array|Name=rowSeries|Description=Data for the table.|Comma=,}}{{CGscriptParameters_Template|Type=array|Name=statisticsValues|Description=Array of StatisticsItems.}} | |||
|Description=Create new 2x1 FixedCrossTable.}} | |||
{{CGscriptConstructors_Template|Parameters= | |||
{{CGscriptParameters_Template|Type=string|Name=rowTitle|Description=Title of row.|Comma=,}}{{CGscriptParameters_Template|Type=array|Name=primaryRowAxis|Description=Axis from Axis_xxx function for the primary row axis.|Comma=,}}{{CGscriptParameters_Template|Type=array|Name=secondaryRowAxis|Description=Axis from Axis_xxx function for the secondary row axis.|Comma=,}}{{CGscriptParameters_Template|Type=string|Name=colTitle|Description=Title of column.|Comma=,}}{{CGscriptParameters_Template|Type=array|Name=primaryColAxis|Description=Axis from Axis_xxx function for the primary column axis.|Comma=,}}{{CGscriptParameters_Template|Type=array|Name=secondaryColAxis|Description=Axis from Axis_xxx function for the secondary column axis.|Comma=,}}{{CGscriptParameters_Template|Type=array|Name=rowSeries|Description=Data for the table.|Comma=,}}{{CGscriptParameters_Template|Type=array|Name=statisticsValues|Description=Array of StatisticsItems.}} | |||
|Description=Create new 2x2 FixedCrossTable.}} | |||
|Methods= | |||
{{CGscriptMethods_Template|ReturnType=string|Name=ToString|Description=The string representation of the object.}} | |||
|Properties= | |||
{{CGscriptProperties_Template|ReturnType=string|Name=ObjectTypeName|HasGetter=1|Description=The name of the type of object.}} | |||
{{CGscriptProperties_Template|ReturnType=TypeInformation|Name=TypeInformation|HasGetter=1|Description=Get information about this class.}} | |||
}} | |||
=== Examples For Table 1x0 === | |||
<source lang="javascript"> | |||
DCS_use(12344983); | |||
// Get Axis: | |||
array axisNew = Axis_new("LuuTest"); | |||
axisNew[AXIS_TEXT] = "Choose a D_Week"; | |||
// Init: | |||
FixedCrossTableRowSeries rowseries; | |||
FixedCrossTableDataSeries dataserie; | |||
FixedCrossTableDataItem dataItemAbs; | |||
FixedCrossTableDataItem dataItemPct; | |||
// Set up a table | |||
// table 1x0 | |||
rowseries = new FixedCrossTableRowSeries(); | |||
dataserie = new FixedCrossTableDataSeries(); | |||
number count; | |||
number countTotal = count() where D_Week != empty; | |||
for(number i = 201301; i < 201305; i++) | |||
{ | |||
Axis_addOption(axisNew, AxisOption_new("Week " + i.ToString(), "")); | |||
count = count() where D_Week == i; | |||
dataItemAbs = new FixedCrossTableDataItem(); | |||
dataItemAbs.Value = count; | |||
dataItemPct = new FixedCrossTableDataItem(); | |||
dataItemPct.Value = count*100/countTotal; | |||
dataserie.Add(dataItemAbs,dataItemPct); | |||
} | |||
// other | |||
Axis_addOption(axisNew, AxisOption_new("Week Other", "")); | |||
count = count() where D_Week != [201301-201304] && D_Week != empty; | |||
dataItemAbs = new FixedCrossTableDataItem(); | |||
dataItemAbs.Value = count; | |||
dataItemPct = new FixedCrossTableDataItem(); | |||
dataItemPct.Value = count*100/countTotal; | |||
dataserie.Add(dataItemAbs,dataItemPct); | |||
dataserie.AbsoluteTotal.Value = countTotal; | |||
dataserie.PercentageTotal.Value = countTotal*100/countTotal; | |||
rowseries.Add(dataserie); | |||
FixedCrossTable table1x0 = new FixedCrossTable("Create by createFixedCrossDiagram - D_Week", axisNew , rowseries, empty); | |||
// genarate table: | |||
createFixedCrossDiagram(table1x0); | |||
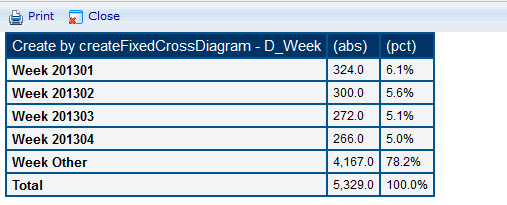
</source> Result:<br/>[[File:Table1x0.png]] | |||
=== Examples For Table 2x1 === | |||
<source lang="javascript"> | |||
DCS_use(15517112); | |||
// Get Axis: | |||
array axisRowPrimary = Axis_new("LuuTest1"); | |||
axisRowPrimary[AXIS_TEXT] = "Gender test"; | |||
Axis_addOption(axisRowPrimary, AxisOption_new("Mand", "")); | |||
Axis_addOption(axisRowPrimary, AxisOption_new("Kvinde", "")); | |||
array axisRowSecond = Axis_new("LuuTest2"); | |||
axisRowSecond[AXIS_TEXT] = "Region test"; | |||
Axis_addOption(axisRowSecond, AxisOption_new("Region Hovedstaden", "")); | |||
Axis_addOption(axisRowSecond, AxisOption_new("Other Region", "")); | |||
array axisColPrimary = Axis_new("LuuTest3"); | |||
axisColPrimary[AXIS_TEXT] = "Week test"; | |||
Axis_addOption(axisColPrimary, AxisOption_new("Year 2014", "")); | |||
Axis_addOption(axisColPrimary, AxisOption_new("Year Other", "")); | |||
array arrRowseries ={}; | |||
number count; | |||
FixedCrossTableRowSeries rowseries; | |||
FixedCrossTableDataItem dataItemAbs; | |||
FixedCrossTableDataSeries dataserie; | |||
dataserie = new FixedCrossTableDataSeries(); | |||
dataItemAbs = new FixedCrossTableDataItem(); | |||
dataItemAbs.Value = 1; | |||
dataserie.Add(dataItemAbs,dataItemAbs); | |||
dataserie.Add(dataItemAbs,dataItemAbs); | |||
dataserie.AbsoluteTotal.Value = 1; | |||
dataserie.PercentageTotal.Value = 1; | |||
rowseries.Add(dataserie); | |||
rowseries.Add(dataserie); | |||
arrRowseries = {rowseries,rowseries,rowseries}; | |||
FixedCrossTable table2x1 = new FixedCrossTable("Create by createFixedCrossDiagram ", axisRowPrimary, axisRowSecond,"Column title", axisColPrimary, arrRowseries, empty); | |||
// genarate table: | |||
createFixedCrossDiagram(table2x1); | |||
createCrossDiagram({"Gender","Region"},{"D_Week"}); | |||
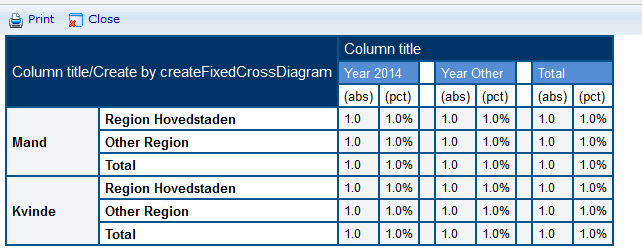
</source> Result:<br/>[[File:Table2x1.png]] | |||
=== Examples For Table 2x2 === | |||
<source lang="javascript"> | |||
DCS_use(15517112); | |||
// Get Axis: | |||
array axisRowPrimary = Axis_new("LuuTest1"); | |||
axisRowPrimary[AXIS_TEXT] = "Gender test"; | |||
Axis_addOption(axisRowPrimary, AxisOption_new("Mand", "")); | |||
Axis_addOption(axisRowPrimary, AxisOption_new("Kvinde", "")); | |||
array axisRowSecond = Axis_new("LuuTest2"); | |||
axisRowSecond[AXIS_TEXT] = "Region test"; | |||
Axis_addOption(axisRowSecond, AxisOption_new("Region Hovedstaden", "")); | |||
Axis_addOption(axisRowSecond, AxisOption_new("Other Region", "")); | |||
array axisColPrimary = Axis_new("LuuTest3"); | |||
axisColPrimary[AXIS_TEXT] = "Week test"; | |||
Axis_addOption(axisColPrimary, AxisOption_new("Year 2014", "")); | |||
Axis_addOption(axisColPrimary, AxisOption_new("Year Other", "")); | |||
array axisColSecond = Axis_new("LuuTest4"); | |||
axisColSecond[AXIS_TEXT] = "Age Group test"; | |||
Axis_addOption(axisColSecond, AxisOption_new("Year 2014", "")); | |||
Axis_addOption(axisColSecond, AxisOption_new("Year Other", "")); | |||
array arrRowseries ={}; | |||
number count; | |||
FixedCrossTableRowSeries rowseries; | |||
FixedCrossTableDataItem dataItemAbs; | |||
FixedCrossTableDataSeries dataserie; | |||
dataserie = new FixedCrossTableDataSeries(); | |||
dataItemAbs = new FixedCrossTableDataItem(); | |||
dataItemAbs.Value = 1; | |||
dataserie.Add(dataItemAbs,dataItemAbs); | |||
dataserie.Add(dataItemAbs,dataItemAbs); | |||
dataserie.AbsoluteTotal.Value = 1; | |||
dataserie.PercentageTotal.Value = 1; | |||
rowseries.Add(dataserie); | |||
rowseries.Add(dataserie); | |||
arrRowseries = {rowseries,rowseries,rowseries,rowseries,rowseries,rowseries}; | |||
FixedCrossTable table2x2 = new FixedCrossTable("Create by createFixedCrossDiagram ", axisRowPrimary, axisRowSecond,"Column title", axisColPrimary, axisColSecond, arrRowseries, empty); | |||
// genarate table: | |||
createFixedCrossDiagram(table2x2); | |||
</source> Result:<br/>[[File:Table2x2.png]] | |||
Revision as of 07:49, 7 December 2015
FixedCrossTable
A resource journal entry
Constructors
- (string rowTitle "Title of row.", array primaryRowAxis "Axis from Axis_xxx function for the primary row axis.", FixedCrossTableRowSeries rowSeries "Data for the table.", array statisticsValues "Array of StatisticsItems.") - Create new 1x0 FixedCrossTable.
- (string rowTitle "Title of row.", array primaryRowAxis "Axis from Axis_xxx function for the primary row axis.", array secondaryRowAxis "Axis from Axis_xxx function for the secondary row axis.", array rowSeries "Data for the table.", array statisticsValues "Array of StatisticsItems.") - Create new 2x0 FixedCrossTable.
- (string rowTitle "Title of row.", array primaryRowAxis "Axis from Axis_xxx function for the primary row axis.", string colTitle "Title of column.", array primaryColAxis "Axis from Axis_xxx function for the primary column axis.", array rowSeries "Data for the table.", array statisticsValues "Array of StatisticsItems.") - Create new 1x1 FixedCrossTable.
- (string rowTitle "Title of row.", array primaryRowAxis "Axis from Axis_xxx function for the primary row axis.", string colTitle "Title of column.", array primaryColAxis "Axis from Axis_xxx function for the primary column axis.", array secondaryColAxis "Axis from Axis_xxx function for the secondary column axis.", FixedCrossTableRowSeries rowSeries "Data for the table.", array statisticsValues "Array of StatisticsItems.") - Create new 1x2 FixedCrossTable.
- (string rowTitle "Title of row.", array primaryRowAxis "Axis from Axis_xxx function for the primary row axis.", array secondaryRowAxis "Axis from Axis_xxx function for the secondary row axis.", string colTitle "Title of column.", array primaryColAxis "Axis from Axis_xxx function for the primary column axis.", array rowSeries "Data for the table.", array statisticsValues "Array of StatisticsItems.") - Create new 2x1 FixedCrossTable.
- (string rowTitle "Title of row.", array primaryRowAxis "Axis from Axis_xxx function for the primary row axis.", array secondaryRowAxis "Axis from Axis_xxx function for the secondary row axis.", string colTitle "Title of column.", array primaryColAxis "Axis from Axis_xxx function for the primary column axis.", array secondaryColAxis "Axis from Axis_xxx function for the secondary column axis.", array rowSeries "Data for the table.", array statisticsValues "Array of StatisticsItems.") - Create new 2x2 FixedCrossTable.
Methods
- string ToString() - The string representation of the object.
Properties
- string ObjectTypeName { get; } - The name of the type of object.
- TypeInformation TypeInformation { get; } - Get information about this class.
Examples For Table 1x0
DCS_use(12344983);

// Get Axis:
array axisNew = Axis_new("LuuTest");
axisNew[AXIS_TEXT] = "Choose a D_Week";

// Init:
FixedCrossTableRowSeries rowseries;
FixedCrossTableDataSeries dataserie;
FixedCrossTableDataItem dataItemAbs;
FixedCrossTableDataItem dataItemPct;
// Set up a table
// table 1x0
rowseries = new FixedCrossTableRowSeries();
dataserie = new FixedCrossTableDataSeries();
number count;
number countTotal = count() where D_Week != empty;

for(number i = 201301; i < 201305; i++)
{
 Axis_addOption(axisNew, AxisOption_new("Week " + i.ToString(), ""));

 count = count() where D_Week == i;
 dataItemAbs = new FixedCrossTableDataItem();
 dataItemAbs.Value = count;
 dataItemPct = new FixedCrossTableDataItem();
 dataItemPct.Value = count*100/countTotal;
 dataserie.Add(dataItemAbs,dataItemPct);
}
// other
Axis_addOption(axisNew, AxisOption_new("Week Other", ""));
count = count() where D_Week != [201301-201304] && D_Week != empty;

dataItemAbs = new FixedCrossTableDataItem();
dataItemAbs.Value = count;
dataItemPct = new FixedCrossTableDataItem();
dataItemPct.Value = count*100/countTotal;
dataserie.Add(dataItemAbs,dataItemPct);

dataserie.AbsoluteTotal.Value = countTotal;
dataserie.PercentageTotal.Value = countTotal*100/countTotal;

rowseries.Add(dataserie);
FixedCrossTable table1x0 = new FixedCrossTable("Create by createFixedCrossDiagram - D_Week", axisNew , rowseries, empty);
// genarate table:
createFixedCrossDiagram(table1x0);
Examples For Table 2x1
DCS_use(15517112);

// Get Axis:
array axisRowPrimary = Axis_new("LuuTest1");
axisRowPrimary[AXIS_TEXT] = "Gender test";
Axis_addOption(axisRowPrimary, AxisOption_new("Mand", ""));
Axis_addOption(axisRowPrimary, AxisOption_new("Kvinde", ""));
array axisRowSecond = Axis_new("LuuTest2");
axisRowSecond[AXIS_TEXT] = "Region test";
Axis_addOption(axisRowSecond, AxisOption_new("Region Hovedstaden", ""));
Axis_addOption(axisRowSecond, AxisOption_new("Other Region", ""));

array axisColPrimary = Axis_new("LuuTest3");
axisColPrimary[AXIS_TEXT] = "Week test";
Axis_addOption(axisColPrimary, AxisOption_new("Year 2014", ""));
Axis_addOption(axisColPrimary, AxisOption_new("Year Other", ""));


array arrRowseries ={};
number count;
FixedCrossTableRowSeries rowseries;
FixedCrossTableDataItem dataItemAbs;
FixedCrossTableDataSeries dataserie;

dataserie = new FixedCrossTableDataSeries();

dataItemAbs = new FixedCrossTableDataItem();
dataItemAbs.Value = 1;
dataserie.Add(dataItemAbs,dataItemAbs);
dataserie.Add(dataItemAbs,dataItemAbs);
dataserie.AbsoluteTotal.Value = 1;
dataserie.PercentageTotal.Value = 1;

rowseries.Add(dataserie);
rowseries.Add(dataserie);

arrRowseries = {rowseries,rowseries,rowseries};

FixedCrossTable table2x1 = new FixedCrossTable("Create by createFixedCrossDiagram ", axisRowPrimary, axisRowSecond,"Column title", axisColPrimary, arrRowseries, empty);
// genarate table:
createFixedCrossDiagram(table2x1);
createCrossDiagram({"Gender","Region"},{"D_Week"});
Examples For Table 2x2
DCS_use(15517112);

// Get Axis:
array axisRowPrimary = Axis_new("LuuTest1");
axisRowPrimary[AXIS_TEXT] = "Gender test";
Axis_addOption(axisRowPrimary, AxisOption_new("Mand", ""));
Axis_addOption(axisRowPrimary, AxisOption_new("Kvinde", ""));
array axisRowSecond = Axis_new("LuuTest2");
axisRowSecond[AXIS_TEXT] = "Region test";
Axis_addOption(axisRowSecond, AxisOption_new("Region Hovedstaden", ""));
Axis_addOption(axisRowSecond, AxisOption_new("Other Region", ""));

array axisColPrimary = Axis_new("LuuTest3");
axisColPrimary[AXIS_TEXT] = "Week test";
Axis_addOption(axisColPrimary, AxisOption_new("Year 2014", ""));
Axis_addOption(axisColPrimary, AxisOption_new("Year Other", ""));

array axisColSecond = Axis_new("LuuTest4");
axisColSecond[AXIS_TEXT] = "Age Group test";
Axis_addOption(axisColSecond, AxisOption_new("Year 2014", ""));
Axis_addOption(axisColSecond, AxisOption_new("Year Other", ""));

array arrRowseries ={};
number count;
FixedCrossTableRowSeries rowseries;
FixedCrossTableDataItem dataItemAbs;
FixedCrossTableDataSeries dataserie;

dataserie = new FixedCrossTableDataSeries();

dataItemAbs = new FixedCrossTableDataItem();
dataItemAbs.Value = 1;
dataserie.Add(dataItemAbs,dataItemAbs);
dataserie.Add(dataItemAbs,dataItemAbs);
dataserie.AbsoluteTotal.Value = 1;
dataserie.PercentageTotal.Value = 1;

rowseries.Add(dataserie);
rowseries.Add(dataserie);

arrRowseries = {rowseries,rowseries,rowseries,rowseries,rowseries,rowseries};

FixedCrossTable table2x2 = new FixedCrossTable("Create by createFixedCrossDiagram ", axisRowPrimary, axisRowSecond,"Column title", axisColPrimary, axisColSecond, arrRowseries, empty);
// genarate table:
createFixedCrossDiagram(table2x2);


