Dashboard element - viewable axis
More actions
Dashboard element - viewable axis
Usage: This element can solely be used by the "cross diagram" element. The element offers a viewable axis choice, where the chosen axis will be used for one of the axes that creates a chart via the cross diagram element. A typical axis choice could e.g. be "Gender" with two options "Men" and "Women". If this option is chosen in the viewer and then sent to a "cross diagram" element, then one of the axis of the generated charts would offer the two items "Men" and "Women" and the Legend of this series would be "Gender".
Example of editor format:
Settings in editor format: Besides the name field we have the following specific choices.
Data cache: The available data caches will be those that you added on the general information tab of the dashboard resource dialog. Choose the one which you also plan to use for the cross diagram element to which it will be associated.
Column name: This is the name that will be shown above the list of offered axes choices in the viewer.
Choose axes to include and highlight default axis: The check box next to this text will help you mass check or un-check the choices of axes in the list below it. The list below shows all the axes that exist in the axis set of the chosen data cache. Tick off those axes that you wish are available to choose in the viewer. If you wish that one of the records is chosen as default in the viewer when opening the dashboard, then you can highlight this axis by clicking on the appropriate record row.
Other elements that can utilize this element:
- Cross diagram element
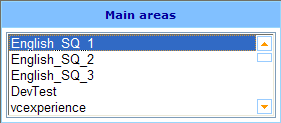
Example of viewable format:
- As can be seen above the column name that was given in the element editor was "Main areas" and the default choice was "English_SQ_1".


