Manage custom Y gridlines in a chart
More actions
Manage custom Y gridlines in a chart
A chart has two different lists of custom Y gridlines; one is in its external style sheet and the other is in its inline style sheet. When viewed, the chart displays all the custom Y gridlines in both of the lists. You manage the two lists respectively through the External Style Sheet and Inline Style Sheet editors. Since the external and inline style sheets of a chart do not share the same list of custom Y gridlines, you cannot modify its inline style sheet to alter the style of a custom Y gridline that you have added to its external style sheet. Additionally, you do not have custom Y gridlines in the inline style sheet inherit settings from the external style sheet.
To manage custom Y gridlines in a bar line, area, point, bubble, or box and whiskers chart through the External Style Sheet and Inline Style Sheet editors:
- Under Axes, select Custom Y gridlines.
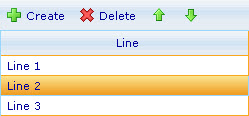
- To add a new custom Y gridline to the chart, click the Add button on the toolbar above the Line list on the right-hand area.
- To arrange the custom Y gridlines in the list so that the ones in higher positions are above the ones in lower positions when they overlap each other in the chart, use the Move up and Move down buttons. Notice that the ones in the inline style sheet are above the ones in the external style sheet.
- To remove a custom Y gridline from the list so that it no longer shows up in the chart, select it and click the Remove button.

