Diagram 3
More actions
The diagram above is a cross diagram which is made by crossing 2 axes together:
- The x-axis will be used a time set.
- The y-axis will be the answer option which used to shown its value.
The following steps show you how to create the above diagram
Step 1.Create a new time set in Time set list.
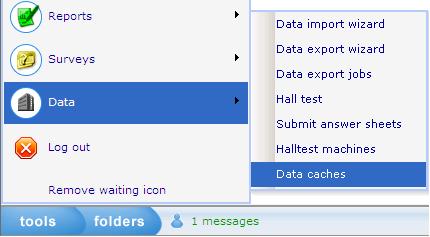
1. Open the Data Cache in Data Cache list (Tools/Data/Data Caches)
2. In the Data Cache tab:
2.1 Select Column’s type then click “Add Column” button to insert a new Custom column
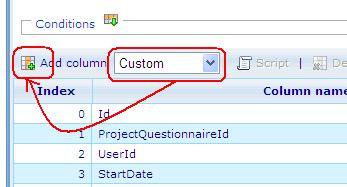
- A new Custom column is used to define the quarters.
- Data type : Number
- Save numbers : 0,1,4 and null.
0 : if the date of the EndDate column is the same quarter with the current date in the system
1 : if the date of the EndDate column is in the previous quarter of current date in the system.
4 : if the date of the EndDate column is in the same quarter but in last year of current date in the system.
Null : if the date of the EndDate column is in other quarters.
2.2 Put the CGScript which defines Current Year and Last Year

- Input Name of the Custom column, this name will be an option of the axis set.
- Insert the CGSript.
| // CGScript array a = DateTime_parse(EndDate, "MM/dd/yyyy"); array today = getDateTime(); number todayYear = today[DateTime_Year]; number todayMonth = today[DateTime_Month]; number TodayQuarter = 1; number endDateQuarter = 1; number IsLastQuarter = 1; number IsThisQuarter = 0; number IsSameQuarterLastYear = 4; if (todayMonth == 1 || todayMonth == 2 || todayMonth == 3) TodayQuarter = 1; else if (todayMonth == 4 || todayMonth == 5 || todayMonth == 6) TodayQuarter = 2; else if (todayMonth == 7 || todayMonth == 8 || todayMonth == 9) TodayQuarter = 3; else TodayQuarter = 4; if (a[1] == 1 || a[1] == 2 || a[1] == 3) endDateQuarter = 1; else if (a[1] == 4 || a[1] == 5 || a[1] == 6) endDateQuarter = 2; else if (a[1] == 7 || a[1] == 8 || a[1] == 9) endDateQuarter = 3; else endDateQuarter = 4; if (a[0] == todayYear && endDateQuarter == TodayQuarter) return IsThisQuarter; else if (a[0] == todayYear && TodayQuarter - endDateQuarter == 1) return IsLastQuarter; else if (todayYear - a[0] == 1 && endDateQuarter == TodayQuarter) return IsSameQuarterLastYear; //End Script |
- Save the Custom column.
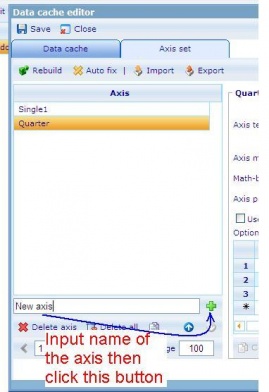
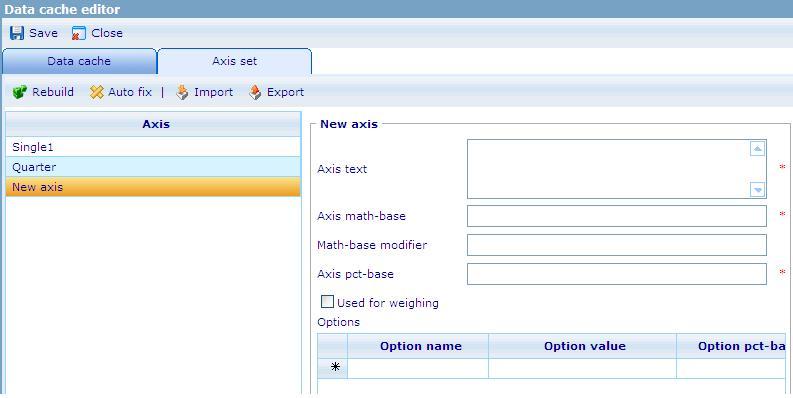
3. Go to the Axis set tab: Create a new axis set
3.2 Input value to the new axis set
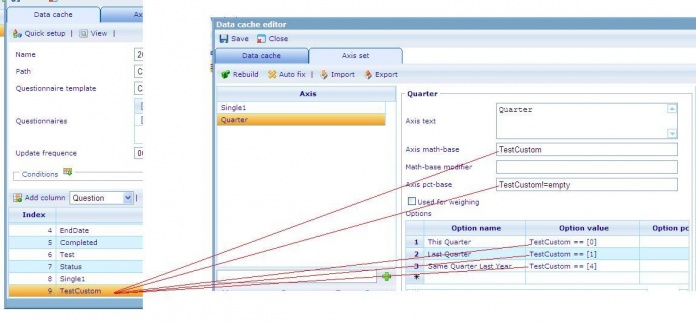
Axis math – base, Axis pct – base, Option value : will be used the Custom column’s name.
For example :
4. Save the Data cache.
Step 2. Create Dashboard item whose type is Cross diagram.
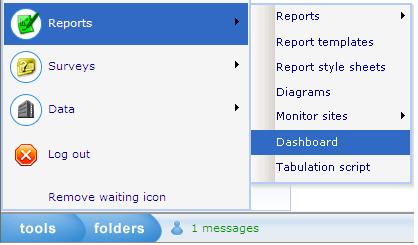
1. Go to Dashboard list (Tools/ Reports/ Dashboard).
2. Create a new dashboard or edit an existing one.
3. In General Information tab: Data caches list must have the DCS which is created at step 1.
4. Layout tab: Create Dashboard items.
4.1 Create Dashboard (DB) item 1 whose type is Shown axis.

o Data cache: use the DCS which is created at step 1.
o This DB item will be used as the X-axis of the cross diagram that has 4 options: Custom Service, Product, Web site and Brand.
4.2 Create Dashboard (DB) item 2 whose type is Shown axis.

o Data cache : use the DCS which is created at step 1.
o This DB item will be used as Y-axis of the cross diagram that has 3 options: Same Quarter Last Year, This Quarter and Last Quarter.
4.3 Create Dashboard (DB) item 3 whose type is Cross diagram :
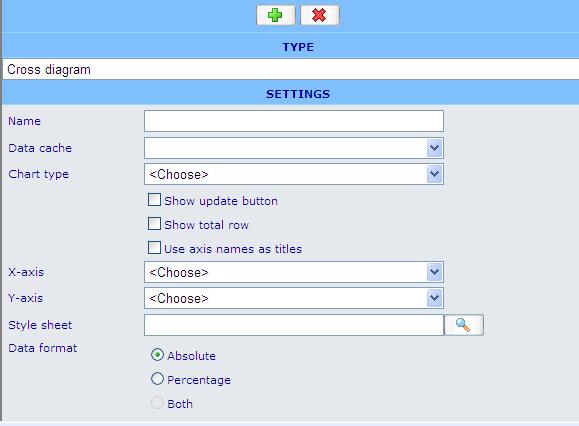
o Data cache: use the DCS which is created at step 1.
o Chart type: Bar
o X – axis: must be DB item 4.1
o Y – axis: must be DB item 4.2
o Style sheet: choose a style sheet which is created in the Style sheet list.
o Data format: absolute
o Direction: Vertical
5. Insert these Dashboard items to the HTML editor then save the Dashboard.
// Finish creating the diagram.

