Category:Data series and data points in bubble charts
Data series and data points in bubble charts
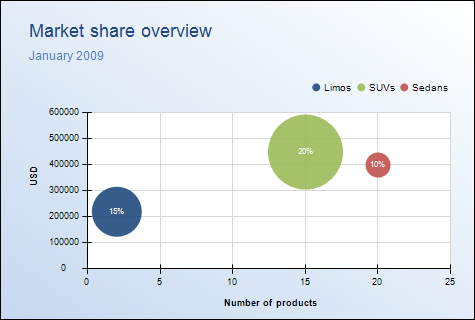
The only data series in a bubble chart consists of one or more data points. Data points are represented by individual bubbles.
Inline style sheet
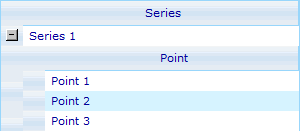
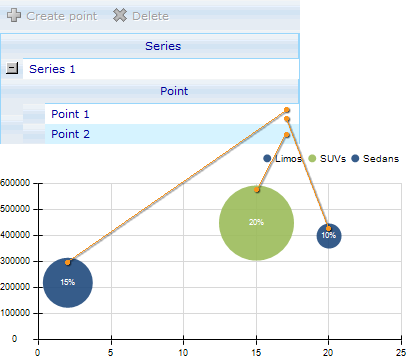
The inline style sheet of a bubble chart contains settings of the data series and data points in the chart. The Inline Style Sheet editor provides access to these settings through a list of data series and data point entries (see the picture below). The list is located under Data series> Series.
This list has one data series entry for the data series in the chart, under which, there are as many data point entries as the number of data points in the data series.
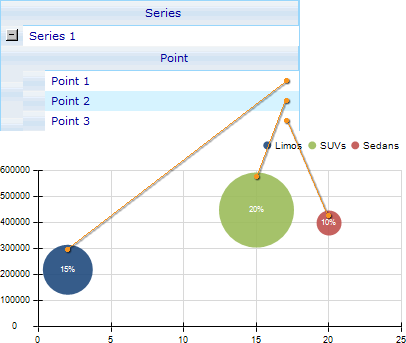
Each data point in the data series is associated with one data point entry in the list so that you can have access to the settings of each individual data point.
For example, if the data series in the chart has three data points, the data series entry in the list will have three data point entries.
External style sheet
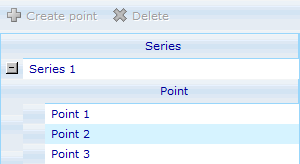
The external style sheet of a bubble chart also contains settings of the data series and data points in the chart. Like the Inline Style Sheet editor, the External Style Sheet editor also provides access to these settings through a list of data series and data point entries (see the picture below). The list is located under Data series> Bubble series.
This list has one data series entry for the data series in the chart, under which, there are a number of data point entries. However, the number of data point entries in the list does not depend on the number of data points in the data series, but rather on how many data points you estimate the data series will have.
For example, if you estimate the data series will have three data points, you would add three data point entries to the list in order to give yourself access to the settings of the three individual data points.
The number of data point entries in the list can be less than the actual number of data points in the data series. In this case, the chart will cycle through the list to pick up settings for every data point in the data series.
For example, if the data series in the chart has three data points, but the data series entry in the list only has two data point entries, the first and second data points will derive settings from the first and second data point entries, and the third data point will also derive settings from the first data point entry.
Pages in category "Data series and data points in bubble charts"
The following 4 pages are in this category, out of 4 total.
