Difference between revisions of "CEM BANK - Weekly tasks on Monday"
m (→Step 2 - Change time frame and rebuild data cache) |
Wikicatglobe (talk | contribs) |
||
| (29 intermediate revisions by 2 users not shown) | |||
| Line 1: | Line 1: | ||
| − | ==Introduction== | + | <accesscontrol>Main:MyGroup</accesscontrol> |
| − | + | == Introduction == | |
| − | == | + | There are several steps that needs to be done each Monday morning (Danish time) to ensure that data collected in the previous week is used correctly in the reporting monitor, and that the information text on the My Portal is correct. |
| − | ===Step 1 - Add week to axis set=== | + | |
| − | Add the last week to the data cache axis set. The reason that this needs to be done is that the user will use this axis in the cross tabulation.<br | + | == Weekly steps == |
| − | *Data cache: <font color= | + | |
| − | *Axis: <font color= | + | === Step 1 - Add week to axis set (Automated) === |
| + | |||
| + | Add the last week to the data cache axis set. The reason that this needs to be done is that the user will use this axis in the cross tabulation.<br> | ||
| + | This step is automated by Tabulation: CEM Bank weekly automation Step 1 (Resource Id: 35182060)<br> | ||
| + | |||
| + | *Data cache: <font color="#ff0000">8386cat - CEM Bank Intelligence</font><br> | ||
| + | *Axis: <font color="#ff0000">- - Uge</font><br> | ||
*Add an extra option that refers to the last week’s week number (name and value). | *Add an extra option that refers to the last week’s week number (name and value). | ||
| − | |||
| − | ===Step 2 - Change time frame and rebuild data cache=== | + | [[Image:CEM-BANK-Axisset.jpg]] |
| − | *Change the end date in the time frame so the DCS only includes data collected before Monday in the current week, which means 23:59:59 on Sunday (DK time) | + | |
| + | === Step 2 - Change time frame and rebuild data cache (Automated) === | ||
| + | This step is automated by Tabulation: CEM Bank weekly automation Step 2 (Resource Id: 35182060)<br> | ||
| + | |||
| + | *Change the end date in the time frame so the DCS only includes data collected before Monday in the current week, which means 23:59:59 on Sunday (DK time) | ||
*Save and rebuild the DCS | *Save and rebuild the DCS | ||
| − | |||
| − | + | <br> [[Image:CEM-BANK-timeframe(new).jpg]] | |
| − | |||
| − | |||
| − | |||
| − | |||
| − | [[Image:CEM-BANK- | ||
| − | + | *Get DCS number by running Work flow: "8386CAT - Get weekly number of records" (Resource Id: 36493340) | |
| − | |||
| − | |||
| − | |||
| − | |||
| − | |||
| − | |||
| − | |||
| − | |||
| − | + | [[Image:Get_CEM_DCS_-_number_of_records.png]]<br> | |
| − | + | * Compare the DCS number with the last week and current week, it should be < 250 | |
| − | + | === Step 3 - Modify information text === | |
| − | + | Modify the text in the information box that is shown to the user on the My Portal-page. | |
| − | * | + | *My Portal element: <font color="#ff0000">CEM Bank Intelligence - Note</font> |
| − | * | + | *Navigate to the tab Detailed description (default) and enter the total number of interviews collected in the third line. |
| − | + | *Change the date on the forth line so it refers to the same date that you defined as end date in the DCS time frame (date of last Sunday). These are the Danish month abbreviations that you will need throughout the year: <font color="#ff0000">jan, feb, mar, apr, maj, jun, jul, aug, sep, okt, nov, dec</font> | |
| − | + | [[Image:CEM-BANK-Notes.jpg]] | |
| − | |||
| − | [[Image:CEM-BANK- | ||
| − | |||
| − | |||
| − | |||
| − | |||
| − | |||
| − | === Step | + | === Step 4 - Update diagram shown in monitor site === |
| − | * | + | *Name: <span style="color: #ff0000">CEM Intelligence - Monitor</span> |
| + | *Path in Monitor: <br>[[Image:SNAG-0004.jpg]] | ||
| − | + | *Diagram: <span style="color: rgb(255,0,0)">8386cat - Årsager til valg af bank, Forventninger (bars) </span> | |
| − | + | Steps: | |
| − | + | *View the diagram with Samtlige banker checked <br>[[Image:Forventninger (bars) - 1.png]] | |
| + | *Note the percentages shown in the diagram, sort them in descending order <br>[[Image:Forventninger (bars).png]] | ||
| + | *Sort the brands in the previous order (Tips: use export/import feature to save time) | ||
| − | + | [[Image:Forventninger (bars) - 2.png]]<br> | |
| − | [[Image: | ||
| − | |||
| − | |||
| − | |||
| − | |||
| − | |||
| − | |||
| − | |||
| − | |||
| − | |||
| − | |||
| − | [[ | + | [[Category:Production_guidelines]] |
Latest revision as of 04:50, 18 October 2013
<accesscontrol>Main:MyGroup</accesscontrol>
Contents
Introduction
There are several steps that needs to be done each Monday morning (Danish time) to ensure that data collected in the previous week is used correctly in the reporting monitor, and that the information text on the My Portal is correct.
Weekly steps
Step 1 - Add week to axis set (Automated)
Add the last week to the data cache axis set. The reason that this needs to be done is that the user will use this axis in the cross tabulation.
This step is automated by Tabulation: CEM Bank weekly automation Step 1 (Resource Id: 35182060)
- Data cache: 8386cat - CEM Bank Intelligence
- Axis: - - Uge
- Add an extra option that refers to the last week’s week number (name and value).

Step 2 - Change time frame and rebuild data cache (Automated)
This step is automated by Tabulation: CEM Bank weekly automation Step 2 (Resource Id: 35182060)
- Change the end date in the time frame so the DCS only includes data collected before Monday in the current week, which means 23:59:59 on Sunday (DK time)
- Save and rebuild the DCS
.jpg)
- Get DCS number by running Work flow: "8386CAT - Get weekly number of records" (Resource Id: 36493340)

- Compare the DCS number with the last week and current week, it should be < 250
Step 3 - Modify information text
Modify the text in the information box that is shown to the user on the My Portal-page.
- My Portal element: CEM Bank Intelligence - Note
- Navigate to the tab Detailed description (default) and enter the total number of interviews collected in the third line.
- Change the date on the forth line so it refers to the same date that you defined as end date in the DCS time frame (date of last Sunday). These are the Danish month abbreviations that you will need throughout the year: jan, feb, mar, apr, maj, jun, jul, aug, sep, okt, nov, dec

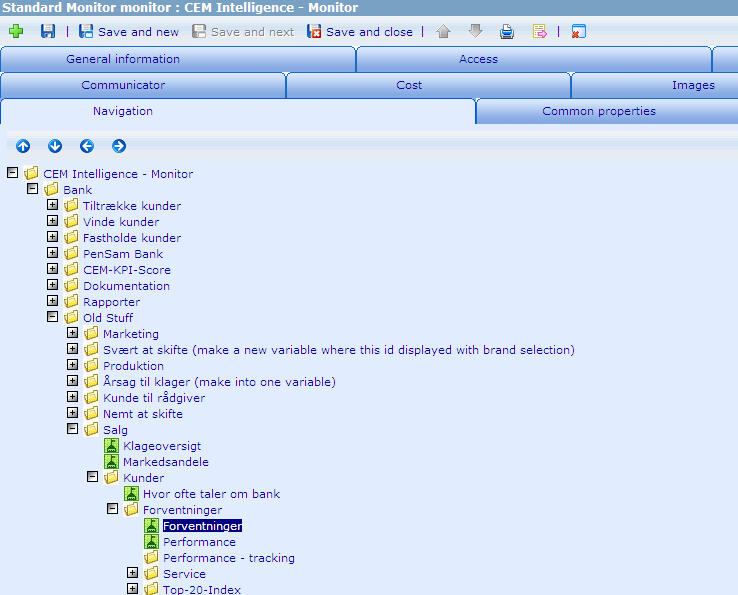
Step 4 - Update diagram shown in monitor site
- Name: CEM Intelligence - Monitor
- Path in Monitor:

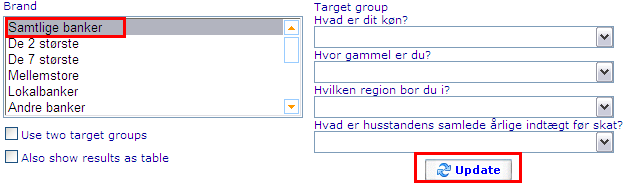
- Diagram: 8386cat - Årsager til valg af bank, Forventninger (bars)
Steps:
- View the diagram with Samtlige banker checked
- Note the percentages shown in the diagram, sort them in descending order
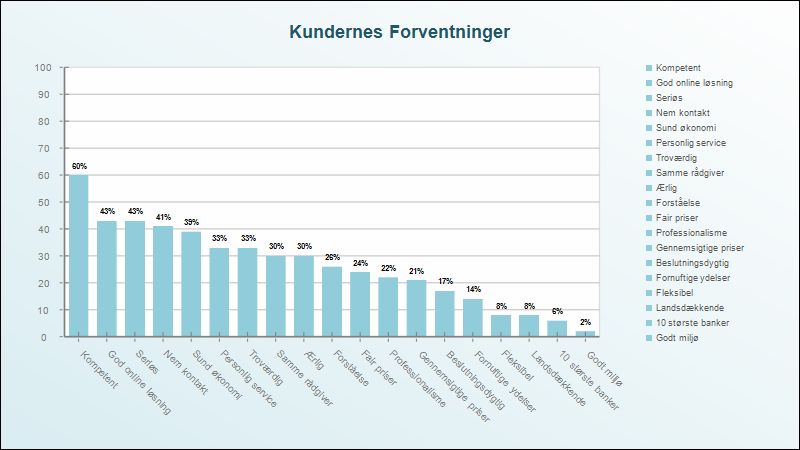
- Sort the brands in the previous order (Tips: use export/import feature to save time)
_-_1.png)
.png)
_-_2.png)