Difference between revisions of "Change the shape of points in point charts"
(jrfconvert import) |
|||
| (One intermediate revision by one other user not shown) | |||
| Line 1: | Line 1: | ||
| − | [[Category: | + | [[Category:Data series and data points in point charts]] |
| − | | + | {{HelpFiles_Report_Module}} |
=====Change the shape of points in point charts===== | =====Change the shape of points in point charts===== | ||
Latest revision as of 13:16, 13 December 2011
Change the shape of points in point charts
To change the shape of all the points in a point chart:
- In the External Style Sheet editor, under Data series, select Point series, or in the Inline Style Sheet editor, under Data series, select Series.
- On the right-hand area of the editor you are using, select the data series entry from the Series list, and then find the Point type setting group on the right side of the area (see the picture below).
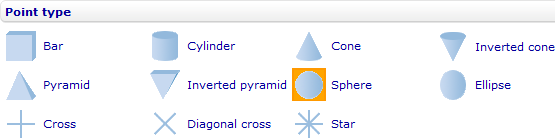
- Select the shape you want the points to look like from the available options under the group.
