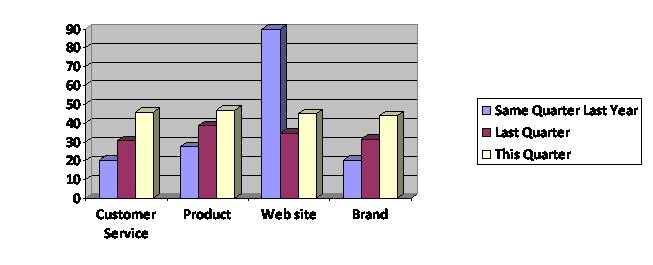
Diagram 1
The diagram above is a cross diagram which is made by crossing 2 axes together:
- The x-axis has 4 options: Custom Service, Product, Web site and Brand.
- The y-axis has 3 options: Same Quarter Last Year, Last Quarter and This Quarter. Calculations for these options are based on values stored in a custom column in the data cache. These values, which are calculated on corresponding values in the EndDate column, indicate whether an RPQ was finished in this quarter, last quarter, or the same quarter last year.
The following steps show you how to create the above diagram
Step 1. Create a new axis set in DCS list based on the EndDate column.
1. Open the Data Cache in Data Cache list (Tools/ Data / Data Caches).
2. In the Data Cache tab:
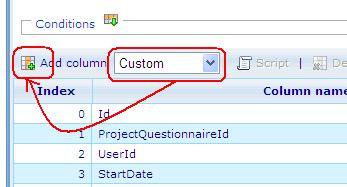
2.1 Select Column’s type then click “Add Column” button to insert a new Custom column.
- The new Custom column is used to define the Quarter which this record is related to the current day in the system.
- Data type: Number
- Save numbers: 0,1,4 and null.
0: if the date of the EndDate column is in the same quarter of current date in the system.
1: if the date of the EndDate column is in the previous quarter of current date in the system.
4: if the date of the EndDate column is in the same quarter but in the last year of current date in the system.
Null: if the date of the EndDate column is in other quarters.
2.2 Put the CGScript which defines Current Quarter, Last Quarter and the Same Quarter Last Year :


