Diagram 2
Revision as of 09:06, 3 September 2009 by Catglobe (talk | contribs) (Created page with 'Image:Diagram_2.JPG The diagram above is a cross diagram which is made by crossing 2 axes together:<br>- The X-axis has 12 options: Jan, Feb, Mar, … Dec<br>- The Y- axis h…')
The diagram above is a cross diagram which is made by crossing 2 axes together:
- The X-axis has 12 options: Jan, Feb, Mar, … Dec
- The Y- axis has 2 options: This Year and Last Year. Calculations for these options are based on values stored in a custom column in the data cache. These values, which are calculated on corresponding values in the EndDate column, indicate whether an RPQ was finished in this year or last year.
The following steps show you how to create the above diagram
Step 1. Create a new axis set in DCS list based on the EndDate column.
1. Open the Data Cache in Data Cache list (Tools/Data/Data Caches).
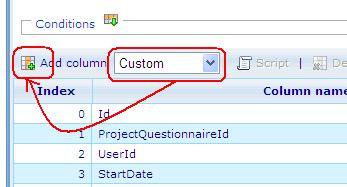
2. In the Data Cache tab :
2.1 Select Column’s type then click “Add Column” button to insert a new Custom column.
