New Report Design - 2009
More actions
<accesscontrol>Main:MyGroup</accesscontrol>
Introduction
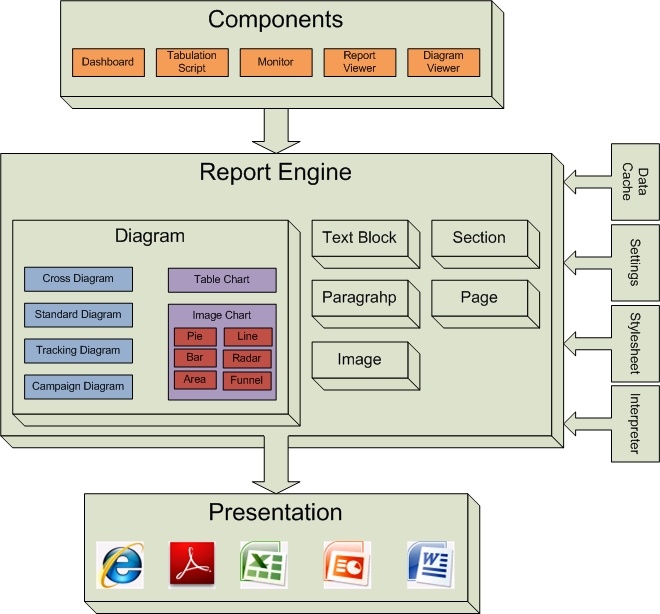
The components/modules that are using Report engine are: Dashboard, Monitor, Tabulation Script, Report Viewer, Diagram Viewer. These modules send request of generation to report engine including:
- A data cache which contains all source data
- Stylesheets (including external and inline stylesheet) to apply
- Kind of presentation that the report should be exported as (pdf, excel, ppt, word, html, image)
- Other kinds of settings
The report engine takes the request, make calculation using the Interpreter, and then export the result into desired format.
A report consists of elements like: diagrams, images, text blocks, pages, paragraphs. The most important element is Diagram, which can be discriminated based on:
- Data
- Cross Diagram
- Standard Diagram
- Tracking Diagram
- Campaign Diagram
- Presentation type
- Table chart
- Image chart which include many kinds of chart like: pie, bar, line, funnel, area, radar etc.
Why a new system?
Current system drawbacks
- Heavy XML processing
- Heavy code duplication
- Inconsistent generation process
Thus it makes the cost of fixing bugs and maintain the old system greater than the cost of making an new system.
New system goals
- Remove the drawbacks of current system
- Side by side working with the old system
- Fully unit testing
- Unit/Integration tests can be run automatically
- Testing API must be simple enough for testers to join writing test cases
- Report API must be keep as simplest as possible
- Design documents must be officially registered on wiki page
Approach to new system
Steps are defined for approaching the new system, which are described below:
- Take the smallest possible case for prototyping (CrossDiagram with one axis for both row and column)
- Design the core functions to server the single case with full testing
- Approach in depth to:
- Tabulation Script
- Diagram Viewer
- StyleSheet
- Different presentation types
- Move on with Report and Report Viewer
- Move on with Monitor
- Move on with Dashboard
- Move on with data calculation optimization
- Performance refining => change design and test cases
- Full implementation for:
- Cross Diagram
- Other diagrams
- All presentation types
- Replace the old system's gui components
Design details
- Report unit testing system
- Diagram generation process
- DiagramInfo
- Tabulation Script
- Tabulation Script for setting inline style to Table Chart
- Diagram viewer control
- Cross diagram settings control
- Report viewer control
- Integrating with Dashboard
- Integrating with Monitor
- Generic object visitor pattern
- Generic XML de-/serialization
- DiagramInfo de-/serialization
- Table chart builder
- Integrating Ajax.Pro and MS AJAX.NET Json Serialization
- Full CrossDigramImplementation
- TrackingDiagram
- Support for IFKA cross diagram layout
- XmlVisitor
- Pdf table layout
- Make pdf generation process in parallel mode
Presentations
Test cases
Lesson learn
This section lists all the:
- Mistakes
- Useful knowledge
that we have encountered during implementation.
Current implementation status
| Modules | Done | To be done | Time estimation |
| CrossDiagram |
|
|
TODO |
| Nevron (image) charts |
|
|
TODO |
| Table charts |
|
|
TODO |
|
Stylesheet |
|
|
TODO |
| Tabulation Script |
|
|
TODO |
| Web controls |
|
|
TODO |
| Unit tests |
|
|
TODO |
| Optimization |
|
|
TODO |
Document revisions
| Version No. | Date | Changed By | Description | Svn revision |
| 0.1 | 27.04.2009 | Nguyen Trung Chinh | Create the first version for working with a single case of CDG | NA |
| 0.1 | 20.07.2009 | Nguyen Trung Chinh | Refine the document | NA |
| 0.2 | 30.07.2009 | Nguyen Trung Chinh | Finish version 0.2 | 54885 |
| 0.3 | 27.10.2009 | Nguyen Trung Chinh | Update implementation status | 57470 |
| 0.4 | 31.12.2009 | Nguyen Trung Chinh | Update status and new projects | 59167 |

