Plot data series in area charts on the primary or secondary Y axis
From Catglobe Wiki
More actions
Plot data series in area charts on the primary or secondary Y axis
To plot a data series in an area chart on the primary or secondary Y axis:
- In the External Style Sheet editor, under Data series, select Area series, or in the Inline Style Sheet editor, under Data series, select Series.
- On the right-hand area of the editor you are using, select the entry associated with the data series you want from the Series list, and then find the Active Y-axis setting group on the right side of the area (see the picture below).
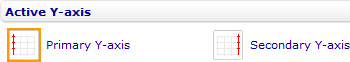
- To plot the data series on the primary Y axis, select Primary Y-axis. To plot it on the secondary Y axis, select Secondary Y-axis.
