Presentation editor
More actions
Presentation editor
The Presentation Editor is one of CatGlobe’s advanced solutions for Office users who want to make professional presentations for MS Power Point. Ease of use and the ability to interact smoothly with Data Cache/Diagrams are the 2 key features of the Presentation Editor module. All presentations made using the editor can be exported to MS Power Point and extracted through a browser as long as your PC has Power Point installed.
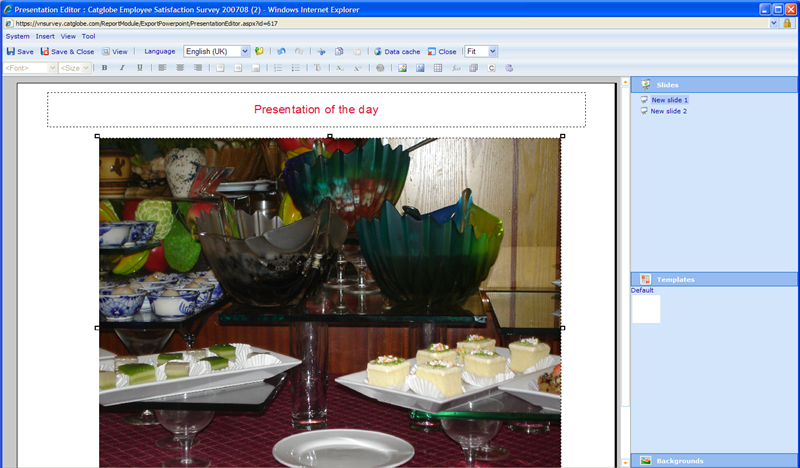
The editor you will be presented with when creating a new presentation is shown below.
The editor consists of a top menu, a tool bar underneath it, the design area, the slide sorter, some default templates that can be clicked to insert new slides, and a library of backgrounds that you can use for your presentations.
In the top menu you will find a number of features and actions. These are shortly described in the table below.
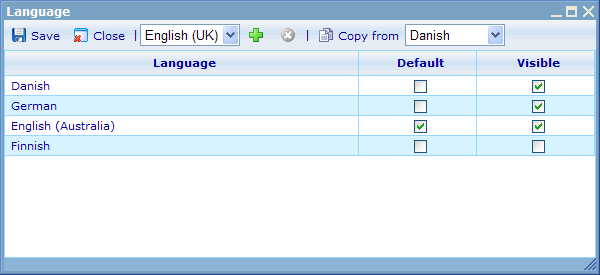
The copy from function is to allow users to copy what they have in on e language to another. This makes it so much easier to manage multiple languages, since you just have to finish one language completely and then copy from that language to other languages and translate all texts in the other languages. This way you keep formats and placements intact and alike.
If any of your language versions of the report are not yet ready to be shown to the users, you can choose to set them to not visible. Even when the logged in user actually has that particular language as mother tongue, he will still not be shown this language version, but rather just be offered the default version instead.
Managing background images
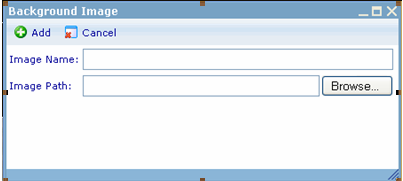
In order to apply a personal background image to a presentation you first have to add it to the library. This is done via the “insert background image” dialogue.
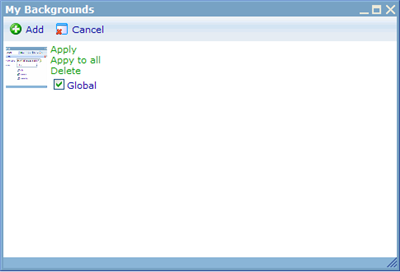
The image can then be found in the list of images and be added to one or more slides as background. Notice that the best size of the image will be 4320 pixels in height and 5760 pixels in width.
Since this is fairly big and may be too heavy for the connection you are on we therefore propose that users set a size of 432 x [n] by 576 x [n] pixel image and allow it to stretch (where [n] is a number from 1 to 10 and can be increased for better quality).
If you have navigation access to it, you can set any background you added to 'global'. This will mean that anyone using the template editor will have access to reuse it for their report templates.
Using the 'Apply' and 'Apply to all' you can further set your slide backgrounds to use the added images!
Using templates
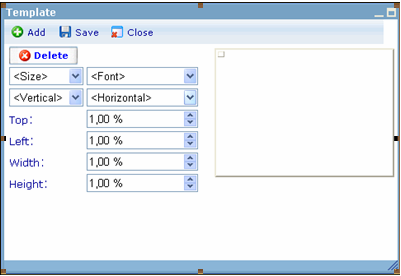
If we need to add several text boxes to your slides which you need all to be located identical places, it is recommended you create a template for the textbox.
Size (1-7), font, vertical alignment (Top/Middle/Bottom) and horizontal alignment (Left/Center/Right) are attributes of the text within the text box. These will default be the fonts used when using the template, but the user can of course change if so wished after having applied the template.
Top and left (from 1% to 100% of the height and width of the slide) are to position the text box into the slide.
Width and height (from 1% to 100% of the width and height of the slide) are to set the size of the text box.
By using the Add button multiple default text boxes, each with different sizes and positions can be inserted into the default template.
After the wished text boxes are added to the template you can save it and it will appear in the template library for all to use:
Advanced features
This help file will not explain how to use the more advanced features of the editor. This advanced features include:
Adding a Data Cache to your presentation. To learn more about using Data Caches for presentations and reports please click on the below link:
Adding a data cache to your reports and diagrams
Another very important feature of Catglobe is the adding of static diagrams. Static diagrams can use the DCS related to the report or it can have an individual DCS. Read more about the logic of DCS attached to different levels of a report using the above link or click the below link to learn more about using the spreadsheet module to create static diagrams.
Static diagrams using spreadsheet
You can also insert expressions into text holders in the presentation. A expression is a calculation that provides a result from the data cache of the report or from a DCS directly attached to the expression. To understand expressions in more detail please click the below link.
Finally you can place constants inside text holders or even inside spreadsheets and expressions. To learn more on what constants can do to make your report personalized to the users please click the below link.

