Difference between revisions of "Time sets"
(jrfconvert import) |
|||
| Line 1: | Line 1: | ||
| − | [[Category: | + | [[Category:Layout tab - The dashboard editor]] |
| | ||
Revision as of 08:41, 29 March 2011
Time sets
Time sets are dashboard elements objects which are used for showing diagrams based on periods split up into certain time intervals. Time set objects can currently only be used when applied as elements into dashboards.
There are two types of dashboard elements that support time sets. These are:
A time set is a definition of how 'time' should be understood in regards to
- time zone
- intervals of time
- limitations in regards to how time can be analyzed
Let us clarify what is meant by this with an example. Let us imagine that we have a company in Denmark that carries out regular employee satisfaction surveys. Employees are sent the survey every 3 months, but not all employees receive the survey at the same time or fill it in at the same time. So in order to analyze the results and the development over time we decide that we want to analyse the received results by quarter. We also decide that we will allow analysis moving over 2 periods (please read further down if you do not understand the moving/rolling average concept).
So from this scenario we have identified a number of things about how we wish to analyze our satisfaction survey by time.
- Periods of time should be understood in GMT+1 (since it is for a Danish company). E.g. Q1 2005 is in this context from 1-1-2005 00:00:00 GMT+1 to 31-3-2005 23:59:59 GMT+1. Depending on which time zone that is used for defining periods there can be up to a full days difference in how periods are understood so this is an important consideration.
- Periods of time are in quarters.
- We allow analysis on real time or with moving averages over 2 quarters at a time.
Further down you will see how we make it possible to define time sets that consider the above requirements.
To go to the time set list navigate via the tools bar to Administration -> Report -> Time sets. This will navigate you to the following list.
From here we have the standard add, edit, delete and close options of lists. We also have a simple search feature where we can search time sets by their name.
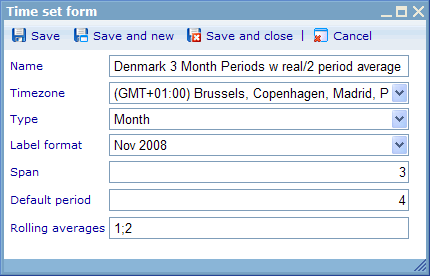
Let us first look at the time set dialog before we explain the available columns in more detail.
The 7 settings of a time set are explained below.
Name: You must give time sets a unique name. It is a good idea to define the information which are in the other settings as a part of the name. This way it is easy for other users to reuse, in case it fulfills their needs.
Time zone: The time zone that will define how periods in the time set are understood. Should be the time set most appropriate to this users who do the analysis of the results.
Type: Defines whether the periods made in the time sets are based on days, weeks, months, or years. Combined with the Span setting it makes it possible to define very flexible periods. When choosing type week then there will be 52 or 53 weeks in a year and weeks may start in one year and end in another. Weeks always start on mondays. To know what label any week will be given please read more below in the paragraph on "label format".
Label format: Each period in an analysis will be used as an axis item in a chart. To explain what the item means it will need to show a label. This drop down shows the different labels that users can choose between.
Note on week labeling clicking here or read the files below to understand the different items of a dashboard in detail, including "Viewable time set" and "Hidden time set".

