Dashboard element - viewable time set: Difference between revisions
More actions
No edit summary |
No edit summary |
||
| Line 1: | Line 1: | ||
[[Category:Layout tab - The dashboard editor]] | [[Category:Layout tab - The dashboard editor]] | ||
| {{HelpFiles_Report_Module}} | ||
====Dashboard element - viewable time set==== | ====Dashboard element - viewable time set==== | ||
Latest revision as of 08:54, 13 December 2011
Dashboard element - viewable time set
Usage: When you want to show data changes over a period of time you need to use a time set as one of the axes of a cross diagram. The following element makes it the dashboard viewer to define certain criteria for the time period being chosen and how it is represented.
Notice that you must have a time set specified before you can use the time set element on a dashboard. Time set records are not made inside the dashboard resource and can be reused by different dashboards. To learn how to add new time set records please click here. If you already have the needed time set elements defined then please continue learning how to relate these to your time set element.
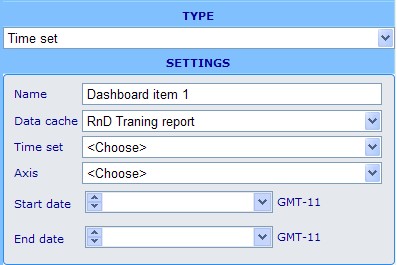
Example of editor format:
Settings in editor format: Besides the name field we have the following specific choices.
Data cache: The available data caches will be those that you added on the general information tab of the dashboard resource dialog. Choose the one which you also plan to use for the cross diagram element to which it will be associated.
Time set: Choice between all the time sets that exist in the system.
Column: Choice of the column on the data cache that holds the date that decides whether or not an answer sheet will be included in a given time set period. (Typically the column called "End_Date" is used. This column identifies the date that an answer sheet was completed.)
Start date: The first date from which we will allow data to be shown in the cross diagram.
End date: The last date from which we will allow data to be shown in the cross diagram.
Other elements that can utilize this element:
- Cross diagram
Example of viewable format:
- The viewer part of the time set may look very different depending on whether the period type day, week, month and year, as well as if there are more than one rolling average to choose among.


