Difference between revisions of "Plot data series in area charts on the primary or secondary Y axis"
| Line 1: | Line 1: | ||
[[Category:Data series and data points in area charts]] | [[Category:Data series and data points in area charts]] | ||
| − | | + | {{HelpFiles_Report_Module}} |
=====Plot data series in area charts on the primary or secondary Y axis===== | =====Plot data series in area charts on the primary or secondary Y axis===== | ||
Latest revision as of 13:05, 13 December 2011
Plot data series in area charts on the primary or secondary Y axis
To plot a data series in an area chart on the primary or secondary Y axis:
- In the External Style Sheet editor, under Data series, select Area series, or in the Inline Style Sheet editor, under Data series, select Series.
- On the right-hand area of the editor you are using, select the entry associated with the data series you want from the Series list, and then find the Active Y-axis setting group on the right side of the area (see the picture below).
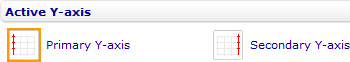
- To plot the data series on the primary Y axis, select Primary Y-axis. To plot it on the secondary Y axis, select Secondary Y-axis.
