New Report Design - 2009: Difference between revisions
From Catglobe Wiki
More actions
| Line 1: | Line 1: | ||
== Introduction == | == Introduction == | ||
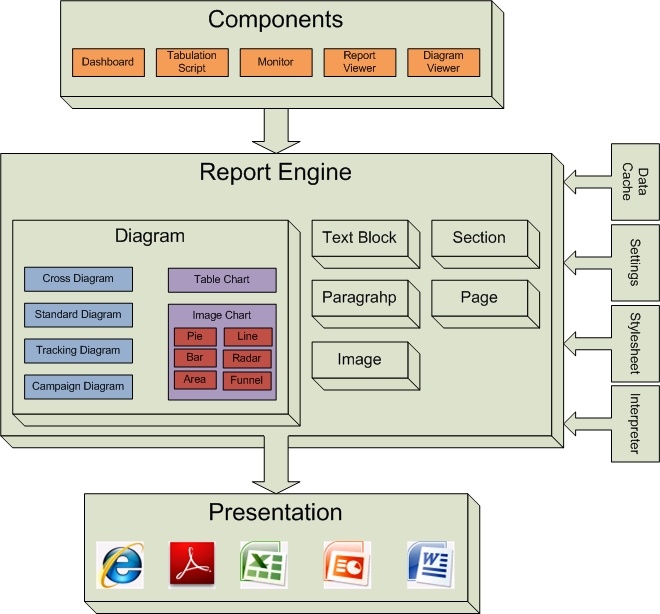
[[Image:]] | [[Image:ReportEngine.jpg]] | ||
The components/modules that are using Report engine are: Dashboard, Monitor, Tabulation Script, Report Viewer, Diagram Viewer. These modules send request of generation to report engine including: | |||
* | * A data cache which contains all source data | ||
* Stylesheets (including external and inline stylesheet) to apply | |||
* | * Kind of presentation that the report should be exported as (pdf, excel, ppt, word, html, image) | ||
* Other kinds of settings | |||
The report engine takes the request, make calculation using the Interpreter, and then export the result into desired format. | |||
A report consists of elements like: diagrams, images, text blocks, pages, paragraphs. The most important element is Diagram, which can be discriminated based on: | |||
* Data | |||
** Cross Diagram | |||
** Standard Diagram | |||
** Tracking Diagram | |||
** Campaign Diagram | |||
* Presentation type | |||
** Table chart | |||
** Image chart which include many kinds of chart like: pie, bar, line, funnel, area, radar etc. | |||
== Concepts == | == Concepts == | ||
Revision as of 06:20, 30 July 2009
Introduction
The components/modules that are using Report engine are: Dashboard, Monitor, Tabulation Script, Report Viewer, Diagram Viewer. These modules send request of generation to report engine including:
- A data cache which contains all source data
- Stylesheets (including external and inline stylesheet) to apply
- Kind of presentation that the report should be exported as (pdf, excel, ppt, word, html, image)
- Other kinds of settings
The report engine takes the request, make calculation using the Interpreter, and then export the result into desired format.
A report consists of elements like: diagrams, images, text blocks, pages, paragraphs. The most important element is Diagram, which can be discriminated based on:
- Data
- Cross Diagram
- Standard Diagram
- Tracking Diagram
- Campaign Diagram
- Presentation type
- Table chart
- Image chart which include many kinds of chart like: pie, bar, line, funnel, area, radar etc.
Concepts
Why a new system?
Current system drawbacks
- Heavy XML
- Code duplication
- Not consistent generation process
New system goals
- Remove all intermediate XML processing
- Remove code duplication
- Consistent generation process
Design details
Current implementation status
- Report unit testing system: rather complete and testers have joined writing a lot of test cases
- CrossDiagram
- Support for one column/row axis
- Cell types
- Presentation type
- Support Nevron image chart
- Tabulation Script
- Support for createCrossDiagram
- Support for setting inline stylesheet
- Diagram viewer control
Next action
- Report viewer control
- Integrating with Dashboard
- Integrating with Monitor
Document revisions
| Version No. | Date | Changed By | Description |
| 0.1 | 27.04.2009 | Nguyen Trung Chinh | Create the first version for working with a single case of CDG |
| 0.1 | 20.07.2009 | Nguyen Trung Chinh | Refine the document |

