Diagram generation process
New Report Design - 2009 => Diagram generation process
Contents
Introduction
Diagram generation process require the inputs which can be in 2 types
- Mandatory
- A data cache
- Selected axes that the diagram will be generated on
- Output type: table or image
- Output format: html, pdf, ppt, excel, image
- Optional
- An external stylesheet
- Inline stylesheet
- Custom settings like: data direction, value to display (absolute/percentage) etc.
Design Goals
- Report's business is moved to separate assembly named CatGlobe.Report
- Hide all detail implementations
- Expose enough information so that from a domain Diagram class we could call something like Build(Diagram) whose parameter is a domain Diagram's instance
Sequence Diagram
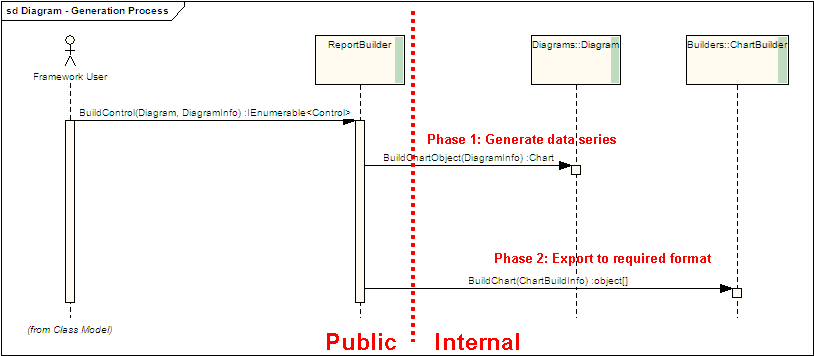
Report framework users just need to know about ReportBuilder class which provide lot of facade methods into report system. Required parameters are usually the domain Diagram instance and DiagramInfo instance. Below are 3 methods for generating diagram:
      /// <summary>
      /// Convenient method for building as web control.
      /// </summary>
      /// <param name="diagram">The domain diagram</param>
      /// <returns>List of html controls that can be rendered</returns>
      public static IEnumerable<Control> BuildControl(this Domain.Reports.Diagram diagram);

      /// <summary>
      /// Convenient method for building as web control.
      /// </summary>
      /// <param name="diagram">The domain diagram</param>
      /// <param name="diagramInfo">Custom build information</param>
      /// <returns>List of html controls that can be rendered</returns>
      public static IEnumerable<Control> BuildControl(this Domain.Reports.Diagram diagram, DiagramInfo diagramInfo);

      /// <summary>
      /// Build diagrams with information from its domain class.
      /// </summary>
      /// <typeparam name="T">Desired returned type</typeparam>
      /// <param name="diagram">The domain class</param>
      /// <param name="reportType"></param>
      /// <returns>The report object</returns>
      public static IEnumerable<T> Build<T>(this Domain.Reports.Diagram diagram, Enum.ReportType reportType) where T : class;
All detail implementations are hidden, but basically diagram generation are 2 phases process:
- From data cache and selected axes, calculate the value series that is to be displayed in chart => this result can be saved and get back later for saving calculation cost
- From calculated data series and required output types, export data series into required formats
The above 2 methods are provided as static methods:
   internal abstract class Diagram
   {
      /// <summary>
      /// Build a <see cref="Chart"/> object from an <see cref="DiagramInfo"/> object.
      /// Static input for building process.
      /// </summary>
      /// <param name="diagramInfo">Input <see cref="DiagramInfo"/> object</param>
      /// <returns>Output <see cref="Chart"/> object</returns>
      public static Chart BuildChartObject(DiagramInfo diagramInfo);
   }

   internal abstract class ChartBuilder
   {
      /// <summary>
      /// Build an Array of charts base on chart object and prentation type
      /// </summary>
      /// <param name="chartBuildInfo">Information needed for building chart</param>
      /// <typeparam name="T">The expected returned type of objects</typeparam>
      /// <returns>A collection of object, for most of the case it returns a single
      /// object. The only cases that more than one object are returned is splitting of
      /// large table into multiple smaller tables </returns>
      public static IEnumerable<T> BuildChart<T>(ChartBuildInfo chartBuildInfo) where T : class;
   }
Detail design
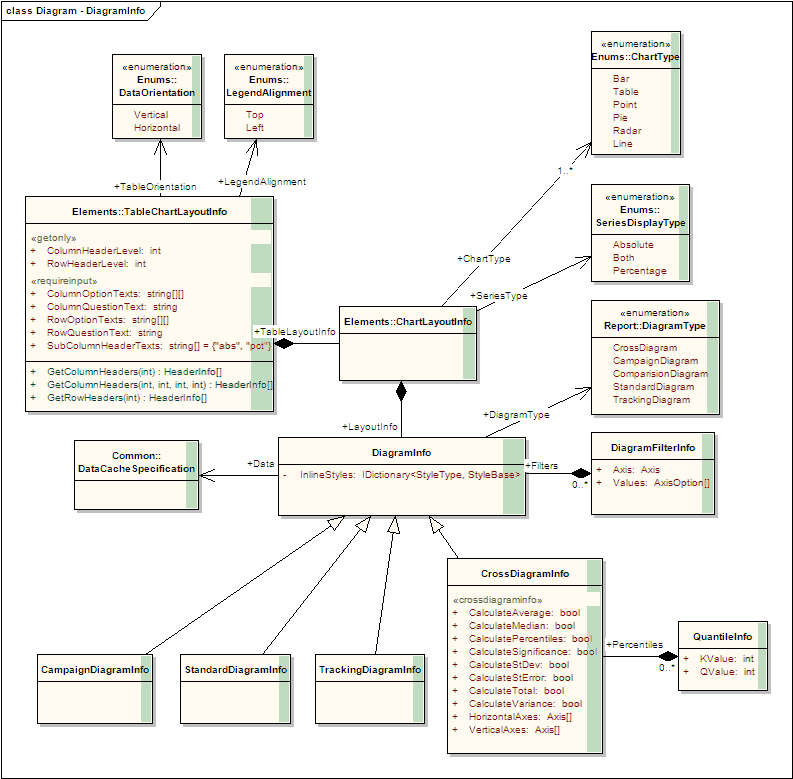
DiagramInfo class
DiagramInfo class is designed to contain all necessary information that is required for generating a diagram. Each diagram has a correspondence class which inherits from DiagramInfo.
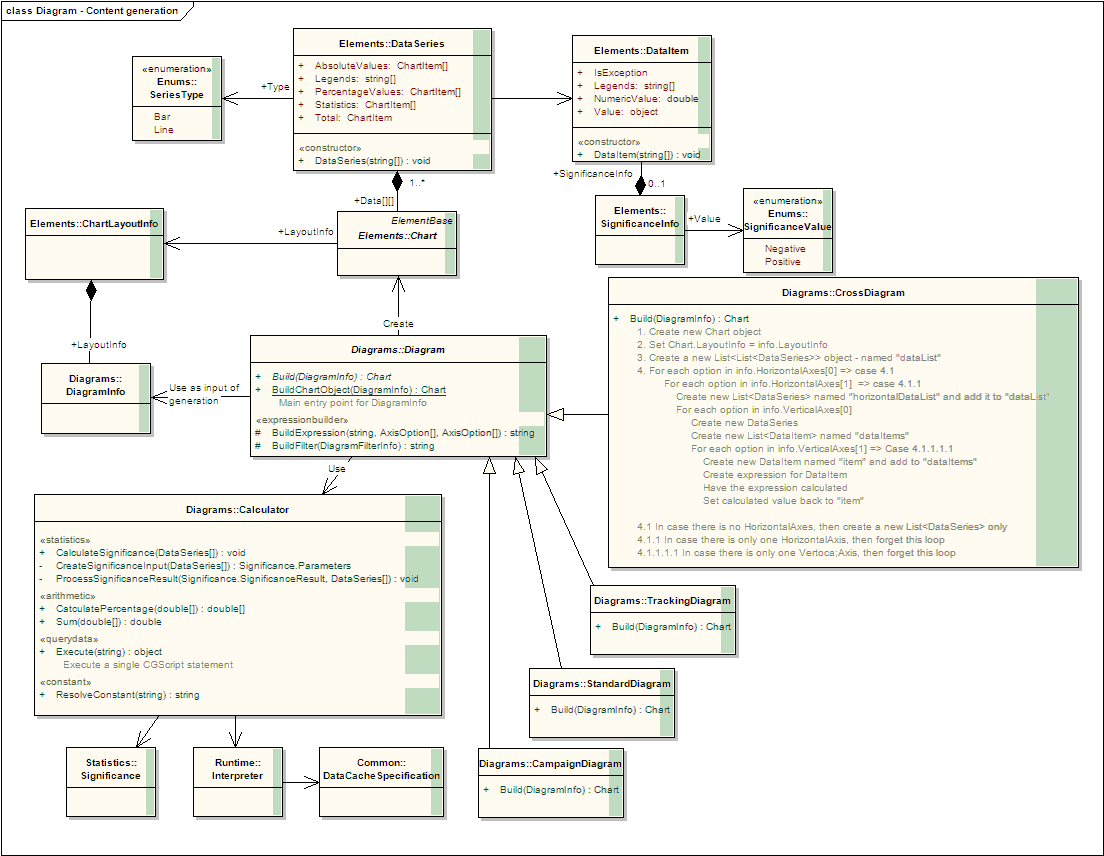
Diagram.GenerateChartObject
Diagram's method GenerateChartObject is the main entry to processing at this phase. Its detail is as below:
- Input: an instance of DiagramInfo
- Output: an instance of Chart which contains a 2 dimensions array for DataSeries (DataSeries will be explained later)
- Processing: each concrete diagram (Cross,Standard,Tracking,Campaign) must provide its own business and use DataCacheSpecification and custom settings of DiagramInfo as input to Interpreter for calculating the required DataSeries. There is a description of how CrossDigram generate cross data in the above diagram
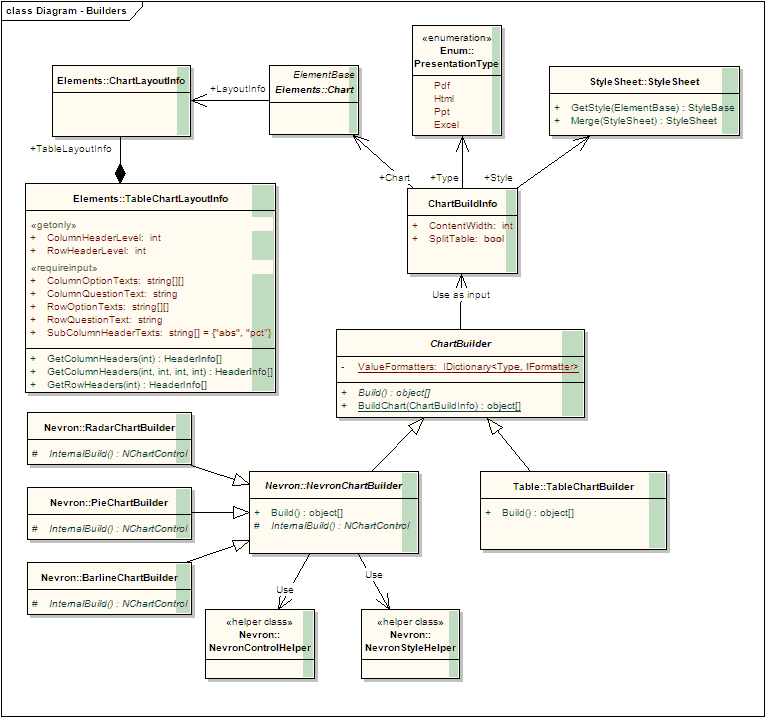
ChartBuilder.BuildChart
DiagramBuilder's method BuildChart is the main entry to processing at this phase. Its detail is as below:
- Input: an instance of ChartBuildInfo which consists of
- Chart instance which contains all calculated data series and layout information
- An external style sheet
- A desired presentation type
- Output: a collection of object which could be of types: ChartTable, NChartControl or image Stream
- Processing: depends on what kind of output type (table/image) then processing will be passed to either NevronChartBuilder (image) or TableChartBuilder. NevronChartBuilder relies on Nevron library for generating image chart (Pie, Bar, Line, Radar etc.). On the other hand, TableChartBuilder use internally developed mechanism for generating tables.
NevronChartBuilder implements Build method as a proxy to the real implementation which is in method InternalBuild. The only current additional processing of Build method is converting from NChartControl to image's Stream. Moreover, all Nevron related DOM processing are put inside utility class NevronControlHelper. The same rule is applied for style, all methods that convert CatGlobe defined style to Nevron defined style are put inside NevronStyleHelper class.
NevronChartBuilder
There is not much to say here, because the steps are simple:
- Create an NChartControl
- Apply Common Styles to chart control
- Add Chart Title
- Add Chart Axes
- Add Data
- Add Legend panel
- Add Custom Labels
- Add Callouts
Need to be reviewed!
There is a small change in building Nevron chart process.
All builder classes must inherit and implement all abstract methods of NevronChartBuilder. The Build method in NevronChartBuilder class should call all abstract methods to build a given chart type.
TableChartBuilder
See this page for detail.
Document revisions
| Version No. | Date | Changed By | Description | Svn revision |
| 0.1 | 04.08.2009 | Nguyen Trung Chinh | First version | 54885 |


